Digital / performance marketing agency · Instagram
From posting content to directing growth
Two years on an agency's own Instagram. Marketing your own marketing agency is a miserable brief — every shortcut shows. This is how it went from publishing whatever landed in the queue to actually having a point of view, and what the numbers did afterwards.
ആദ്യം പണി ചെയ്തു. പിന്നെ എന്തിന് എന്ന് ചോദിച്ചു തുടങ്ങി.First I just did the work. Then I started asking why.
Role
Social Media Strategist
Time on the account
About two years
Platform
Instagram (Meta Business Suite)
Followers
~2.1K → 15.7K
01
I was making the posts. Someone else was making the calls.
Two years on an agency's own Instagram. It didn't start as a strategy job — it started as a publishing job.
What to make usually came down from another department or someone senior. I executed it. Posts went out on schedule, which looked like things were working, but there wasn't much of a strategy underneath — and the video was quietly struggling. High skip rates. People leaving in the first few seconds.
That's the honest starting point. Nobody was doing anything wrong, exactly. The content just wasn't built around anyone in particular.
Where the account started, and where it got to
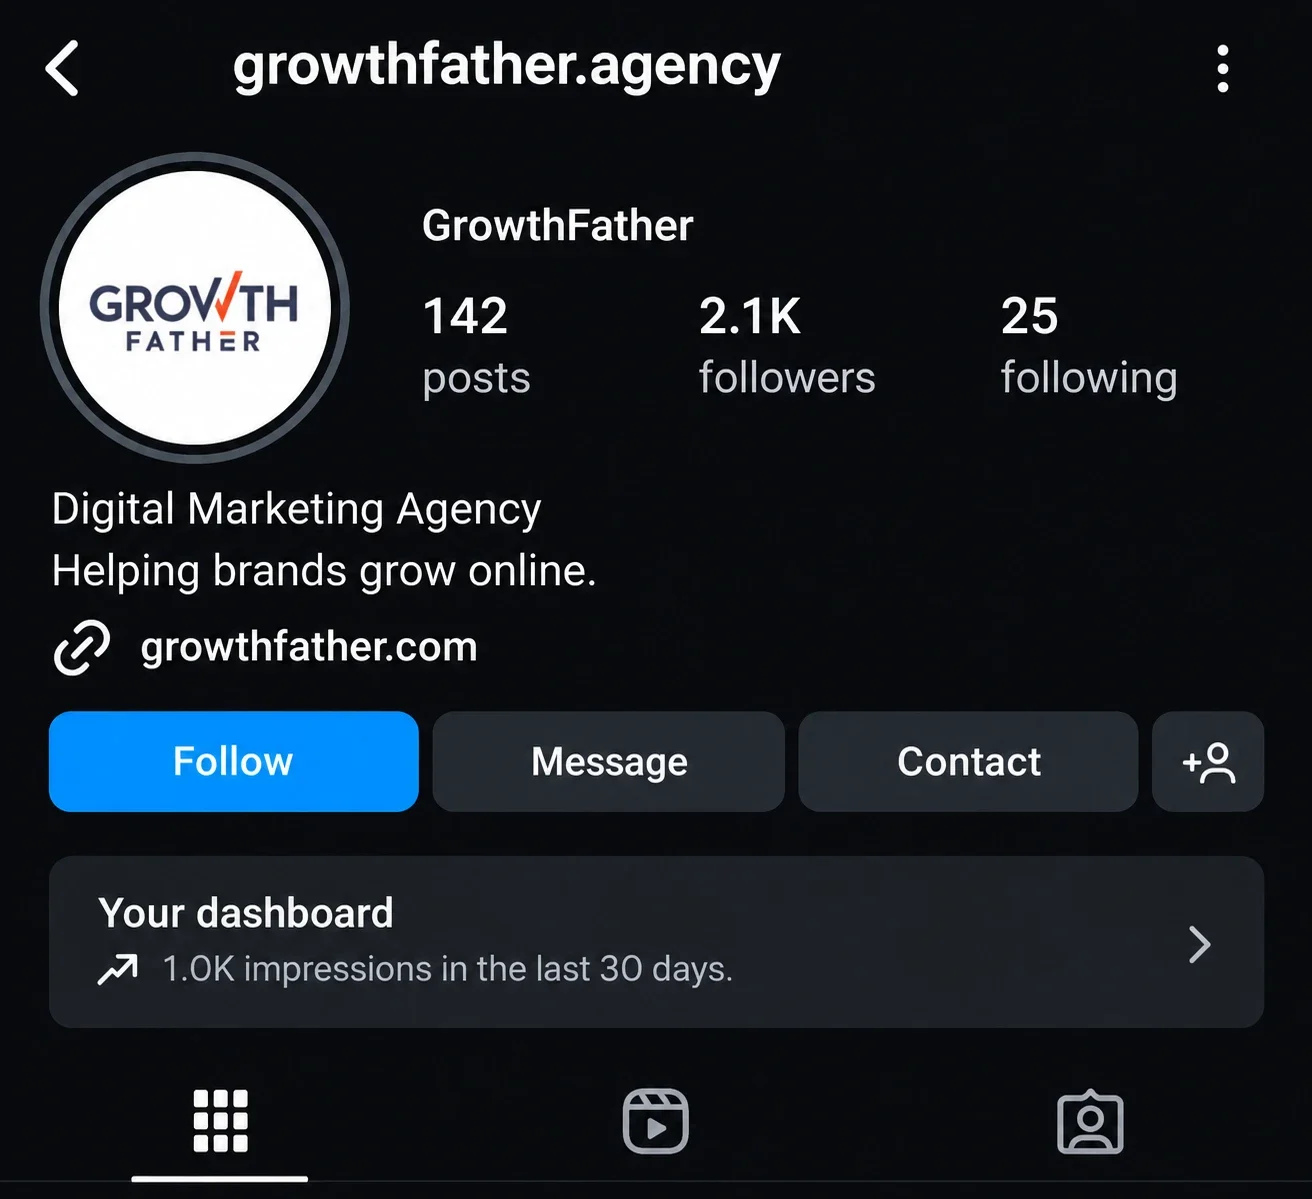
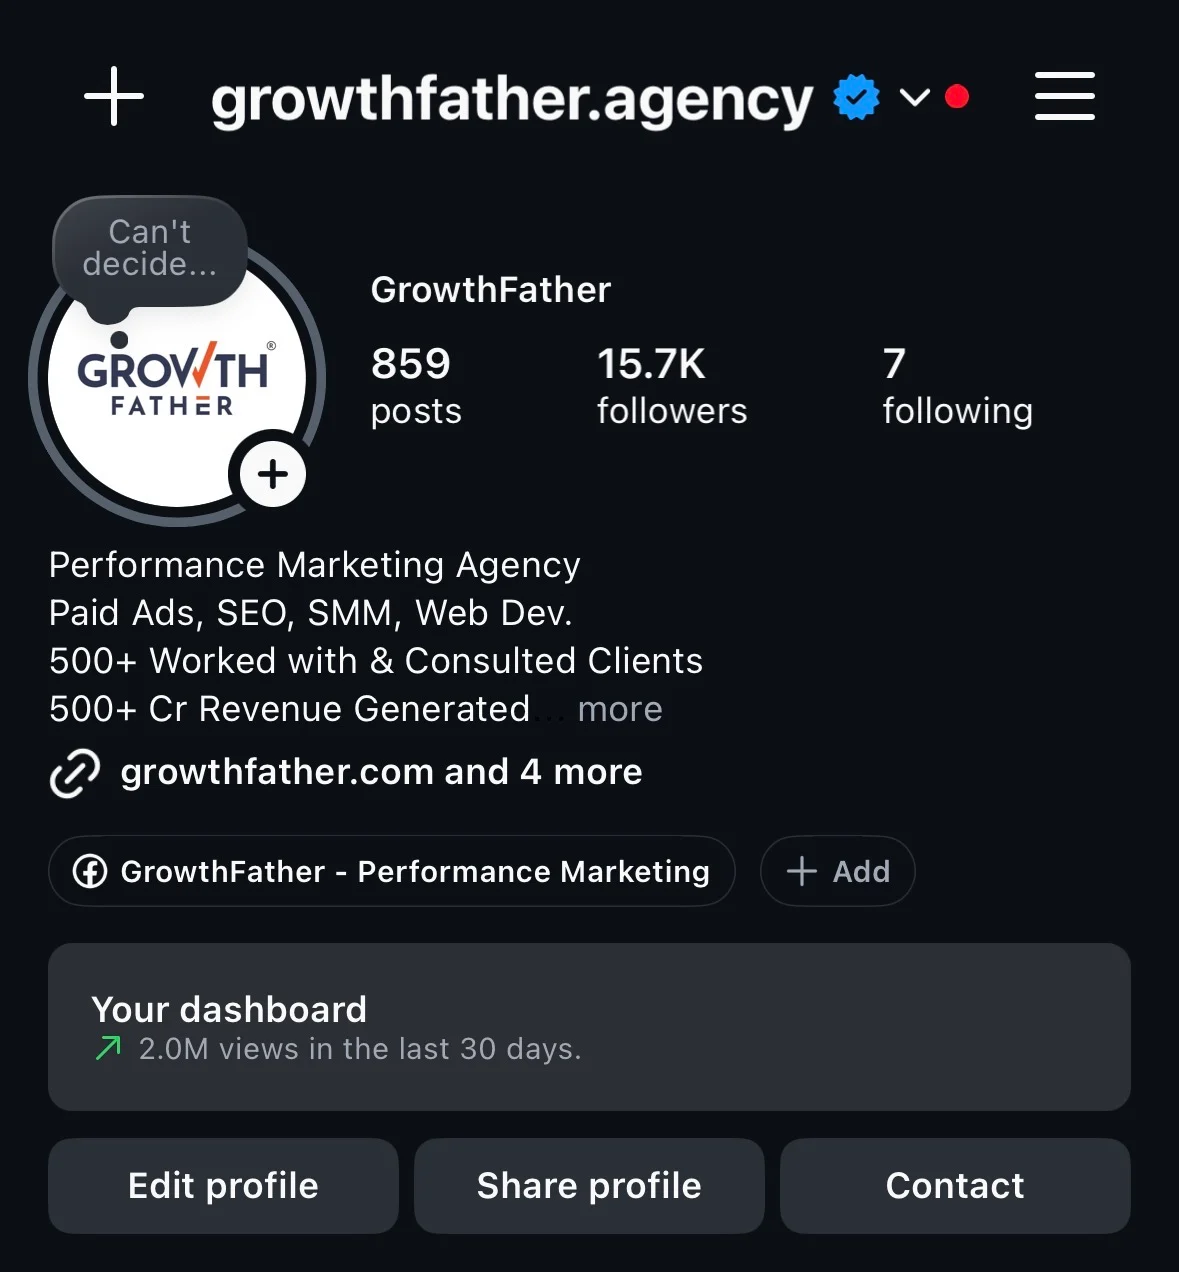
BEFORE · ~2.1K followers — ILLUSTRATIVE RECONSTRUCTION. Drawn from memory, not a saved screenshot.AFTER · 15.7K followers — original screenshot of the current profile.
I'm showing the 'before' as a reconstruction because that's what it is — I didn't save a screenshot back then, and I'd rather draw it honestly than pretend I have one. The Meta reports further down are the real evidence.
02
Then I started choosing what we made
Nobody handed me the keys. I just started doing the research nobody had time for — pulling apart other brands, noticing which formats kept people watching, paying attention to how a story was opened rather than what it was about.
From there it was writing the ideas down, scripting them properly, and then sitting with the presenter, the editor and the designer to get them made. Their suggestions went in constantly — plenty of the good bits weren't mine. But the direction stopped being accidental.
ആരും ചുമതല തന്നില്ല. ഞാൻ എടുത്തു എന്നേയുള്ളൂ.Nobody put me in charge of it. I just started doing it.
What that actually meant, day to day
Social media strategy
Content research
Content ideation
Content planning
Reel scriptwriting
Creative direction
Presenter coordination
Video editor coordination
Designer coordination
Carousel storytelling
Content experimentation
Performance analysis
Audience-relevant storytelling
Kerala business storytelling
Niche blending
What was mine
✓The research, the ideas and the strategy
✓Reel scripts and carousel structure
✓Creative direction across the content
✓Reading the numbers and changing the next thing because of them
What wasn’t
—Being on camera
—The video editing and the design execution
—Credit for the account's growth on my own
A team made this. Presenters, editors, designers, and people who told me when an idea was weak. My part sat upstream of production.
ആറെണ്ണം നോക്കി. ഒന്ന് പാളി.Tried six. One flopped.
03
Six things we tried. Most of them were fine. One wasn't.
This took months, not a weekend. Here's the actual order, including the formats that went nowhere — those are the useful ones to know about.
01 · Educational marketing content
Marketing information, general explainers, posters and videos. Safe. Nobody objected to any of it, which was sort of the problem.
02 · Text-based, minimal carousels
Plain backgrounds, useful information, no decoration. Cheap to make and they held up reasonably well.
03 · Visual storytelling
Visual-first slides, illustrated and comic-inspired. More effort per post, and you could feel people actually reading them.
04 · Designer-led informational carousels
Properly designed slides — which sounds like an upgrade, except they kept getting text-heavy and the results never settled into a pattern.
05 · Global brand stories
Big international campaigns and business news. Engagement climbed, then flattened out. Interesting, but not ours.
06 · Kerala business stories
Local entrepreneurs and regional brands. This is the one.
What niche blending meant here
Our audience wasn't one thing. Some followed for marketing, some for business news, some because a reel about a local company turned up on their feed. Niche blending is just refusing to pick one lane — taking a business story and telling it with a marketer's eye for the hook, so it lands for both groups instead of half of them. The Kerala stories below are that idea working: a spice company is business news, but the reason it travelled is the way the first slide was written.
04
The question that changed it
Why are we talking about global brands to an audience sitting in Kerala?
So I tested it. Local entrepreneurs, regional companies, business developments from closer to home. An early one about a spice business did noticeably better than it had any right to — and after that the pattern held. Kerala-focused storytelling became a real part of the strategy rather than an experiment.
നാട്ടിലെ കഥ പറഞ്ഞപ്പോൾ ആളുകൾ കേട്ടു തുടങ്ങി.The moment we told stories from home, people started listening.
Worth saying: the point was never the view count. It was credibility, people actually engaging, followers worth having, and business conversations starting. Views are just the easiest thing to screenshot.
ഇനി number നോക്കാം.Right — the numbers.
05
Okay — but did it work?
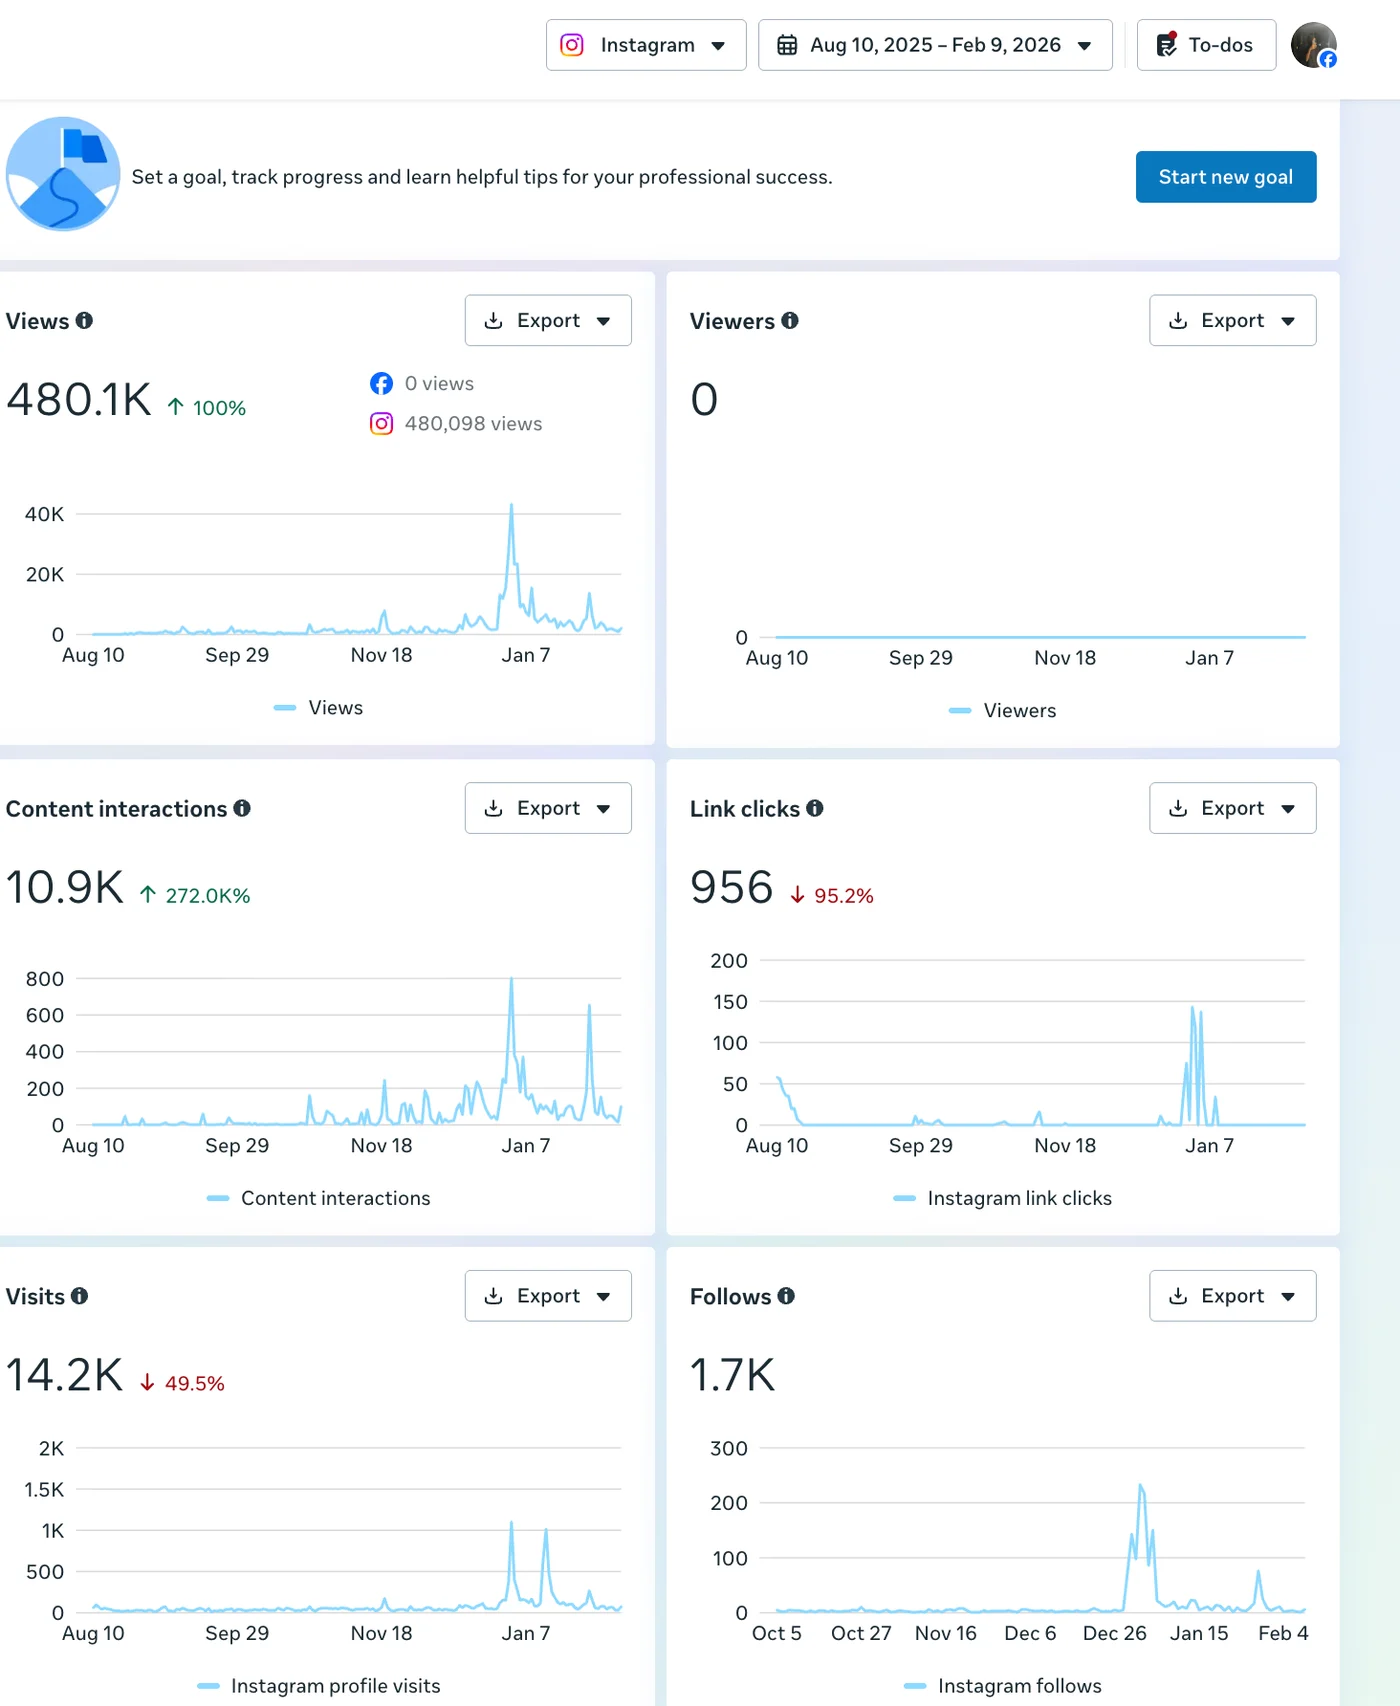
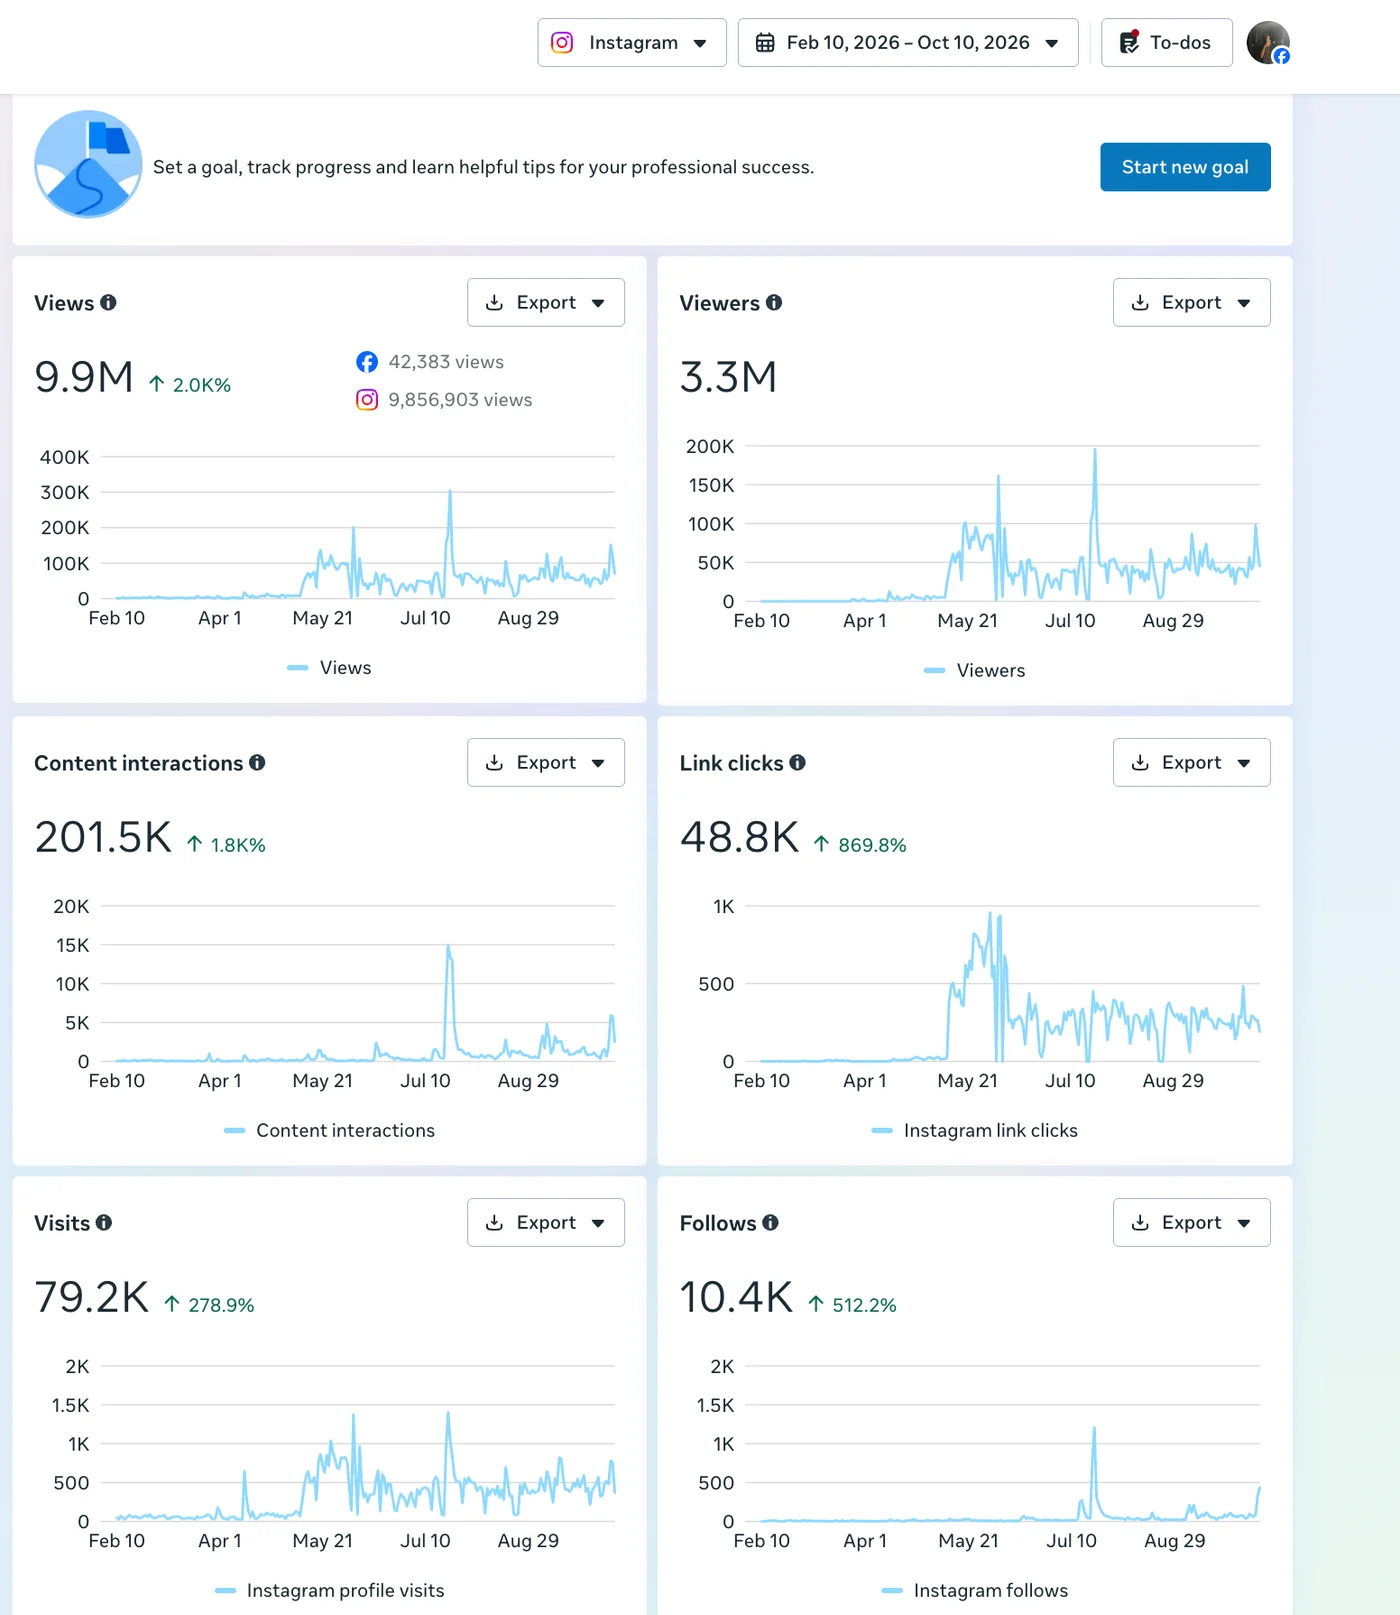
Two Meta Business Suite reports, before and after. Read the notes under the table; the two windows aren't the same length and I'm not going to pretend they are.
Earlier
Aug 10, 2025 – Feb 9, 2026
184 days · Instagram · Meta Business Suite
Strategy-led
Feb 10, 2026 – Oct 10, 2026
243 days · Instagram · Meta Business Suite
Metric
Earlier
Strategy-led
Per 30 days (fairer)
Instagram views
480K
9.86M
~78.3K → ~1.22M · 15.5×
Content interactions
10.9K
201.5K
~1.8K → ~24.9K · 14.0×
Profile visits
14.2K
79.2K
~2.3K → ~9.8K · 4.2×
Link clicks
956
48.8K
~156 → ~6K · 38.7×
Follows
1.7K
10.4K
~277 → ~1.3K · 4.6×
◦Exact Instagram figures: 480,098 → 9,856,903. Facebook added 42,383 views in the later period (9.9M total) — kept separate, not merged into the Instagram number.
◦The windows are 184 vs 243 days, so the per-30-day column is the fairer read. The raw multiples flatter me.
◦In the earlier report the Follows chart starts on Oct 5, not Aug 10 — so that one figure may cover a shorter span than the rest.
◦These are reporting windows, not the date the new direction started.
◦Viewers aren't compared at all: the earlier report shows 0 viewers, so there's nothing to compare against. The later window shows 3.3M.
◦Account-level totals. Plenty of people contributed to these.
The reports themselves
Earlier window · Aug 10, 2025 – Feb 9, 2026 (184 days)Strategy-led window · Feb 10, 2026 – Oct 10, 2026 (243 days)
Every number in that table is read off these two. Tap to enlarge.
Most recent snapshots
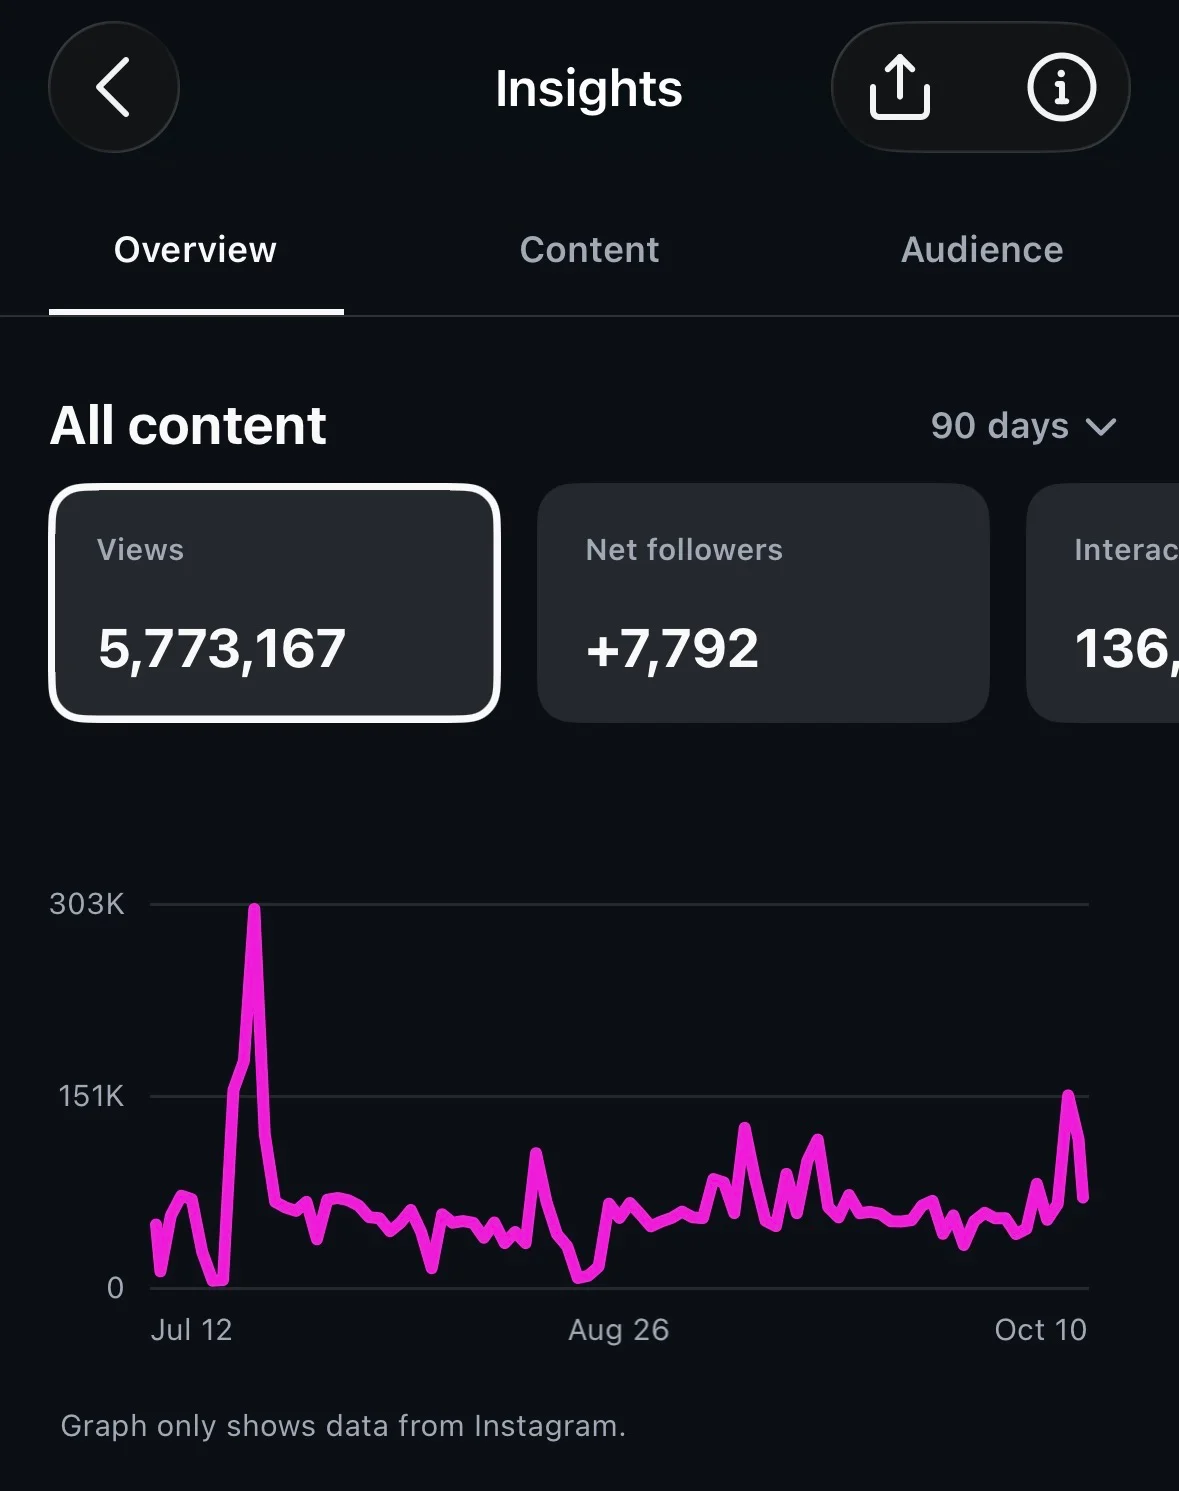
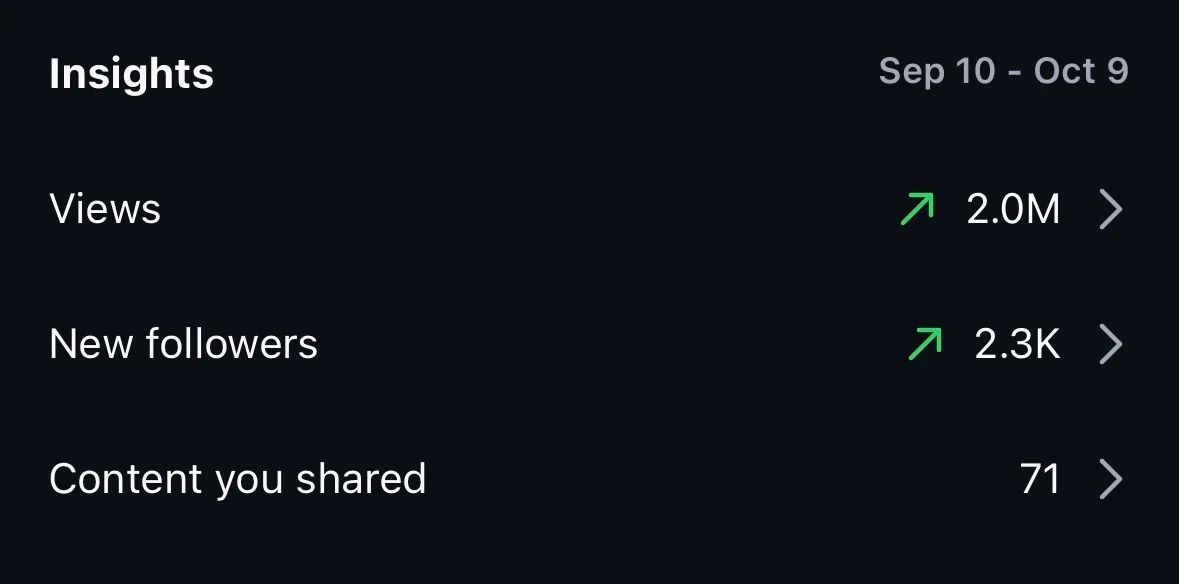
Last 90 days to Oct 10 · 5,773,167 views · +7,792 net followersSep 10 – Oct 9 · 2.0M views · 2.3K new followers · 71 posts shared
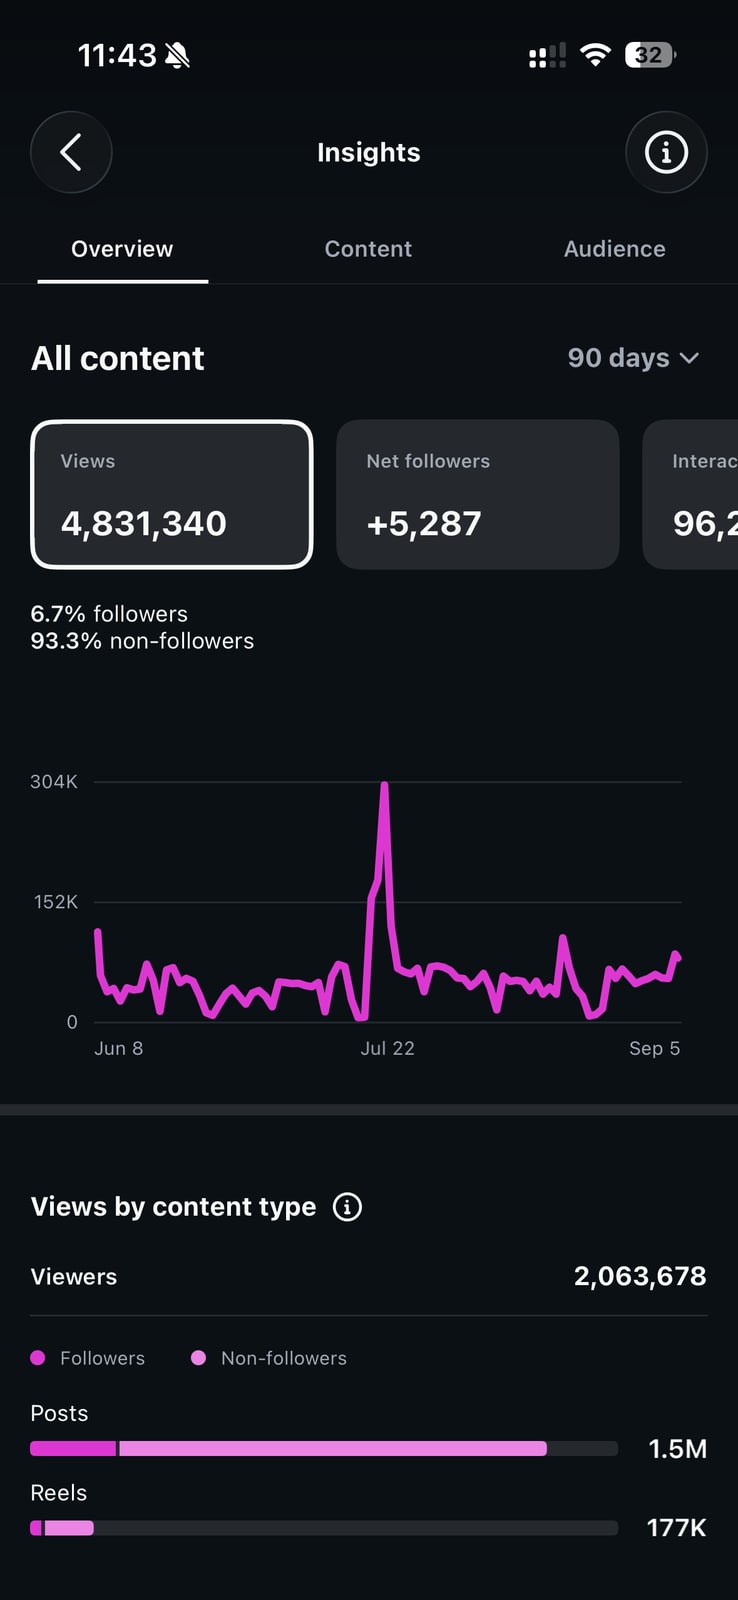
All content · 90 days
Instagram · Last 90 days
4,831,340 views · +5,287 net follows · 2,063,678 viewers
Account-wide content performance. The same screen reports the audience split as 6.7% followers / 93.3% non-followers. Account-level; not attributable to a single person or campaign.
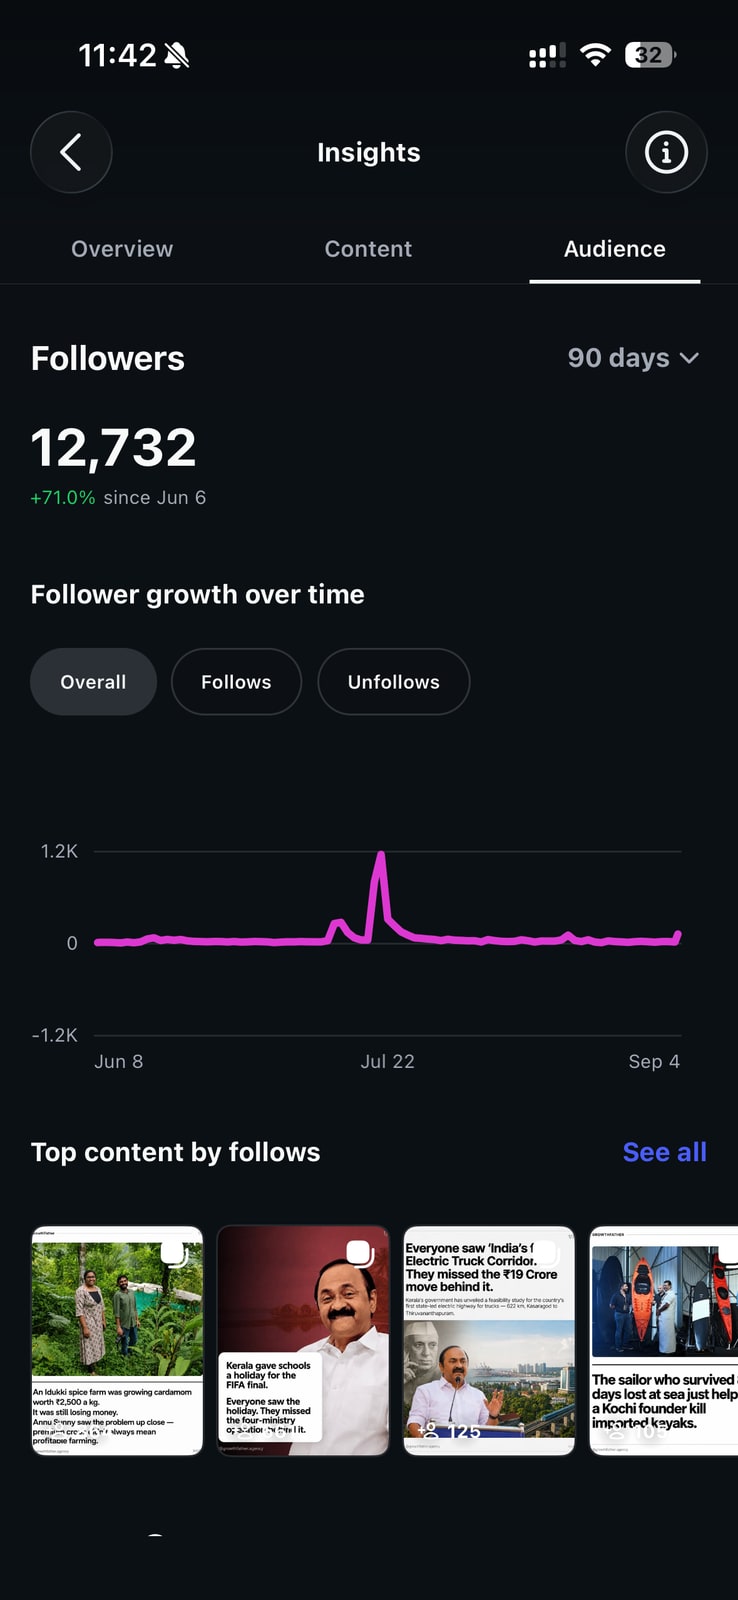
Follower growth · 90 days
Instagram · Last 90 days
12,732 followers
Account insights showing follower count and a follower-growth-over-time chart. Account-level; the screenshot does not attribute the change to any particular activity.
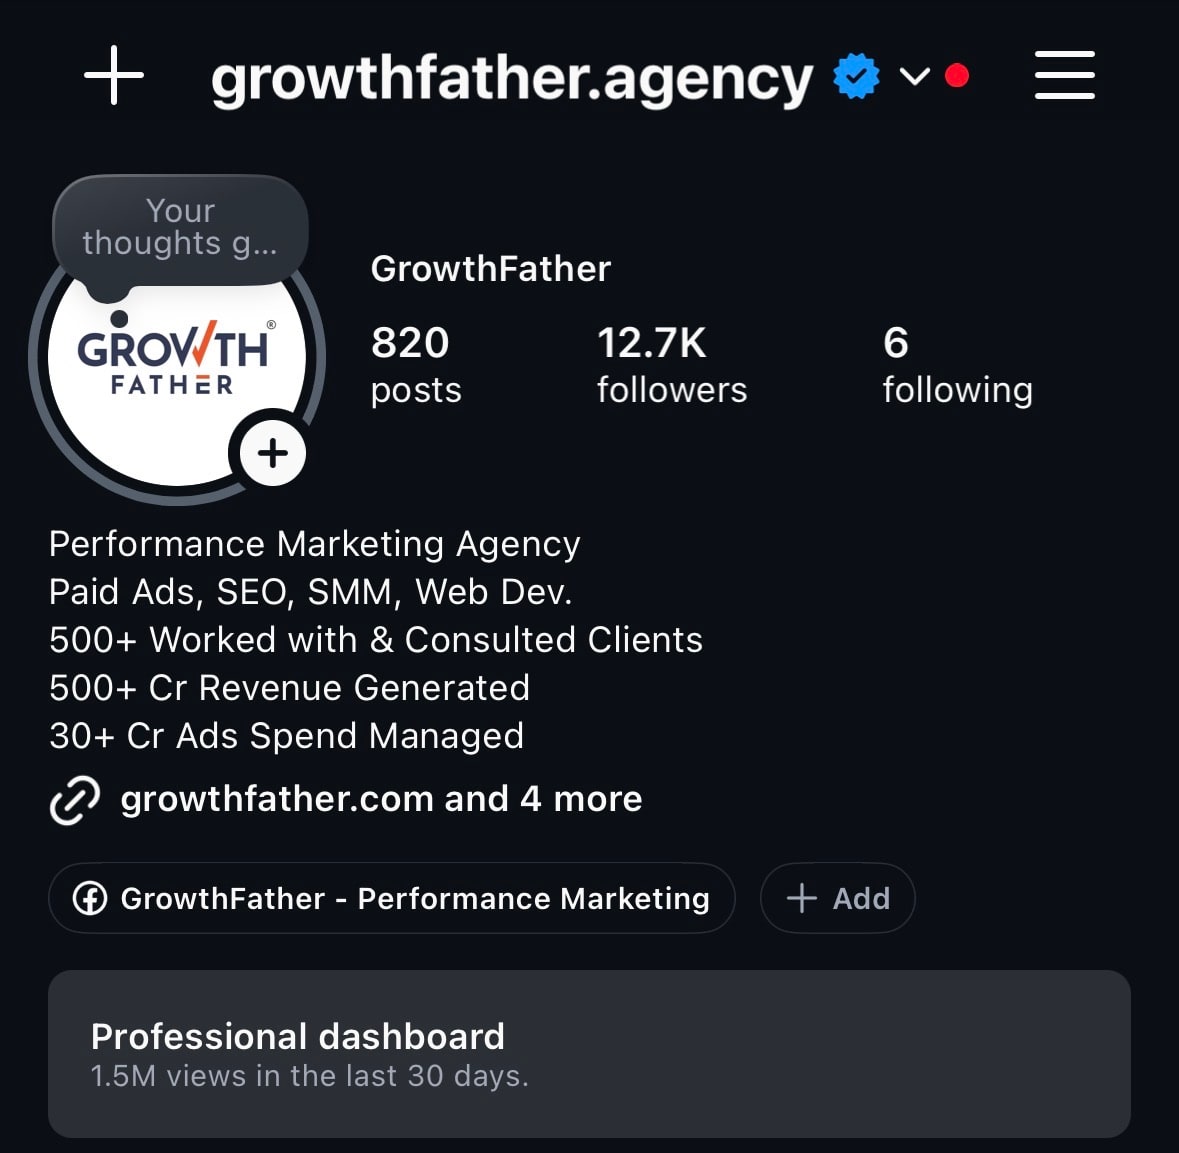
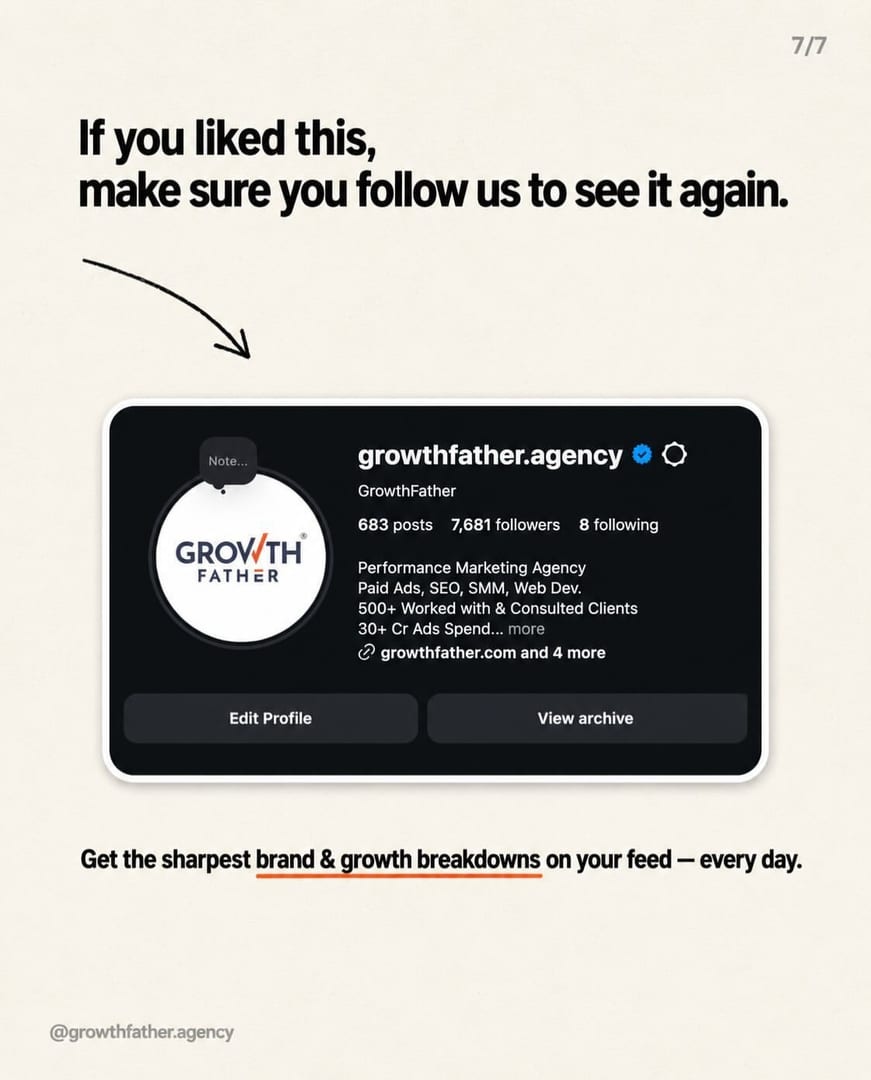
The account itself
Instagram · Professional dashboard figure covers the last 30 days
12.7K followers · 820 posts · professional dashboard reports 1.5M views in the last 30 days
The agency's own Instagram profile. Account-level context only; no individual attribution is claimed.
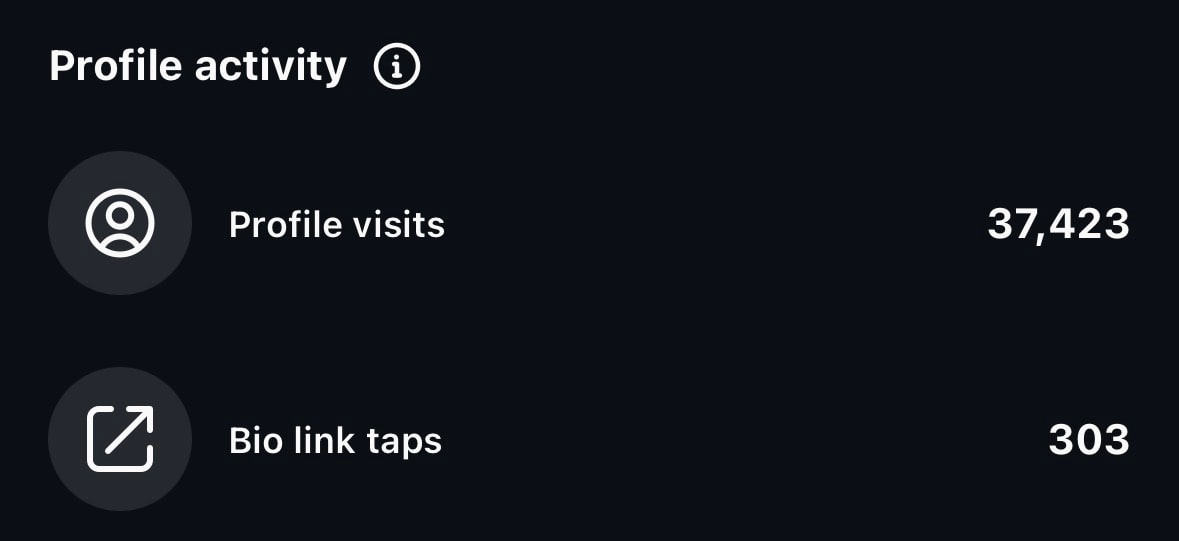
Profile activity
Instagram
37,423 profile visits · 303 bio link taps
Profile activity panel. The screenshot does not state the period it covers, so none is recorded.
Older account snapshots from along the way. The one worth noticing is the 6.7% followers / 93.3% non-followers split — that's the content reaching past the people who already knew us.
06
The posts that did the work
Idea, then the actual thing we published, then what Instagram said about it.
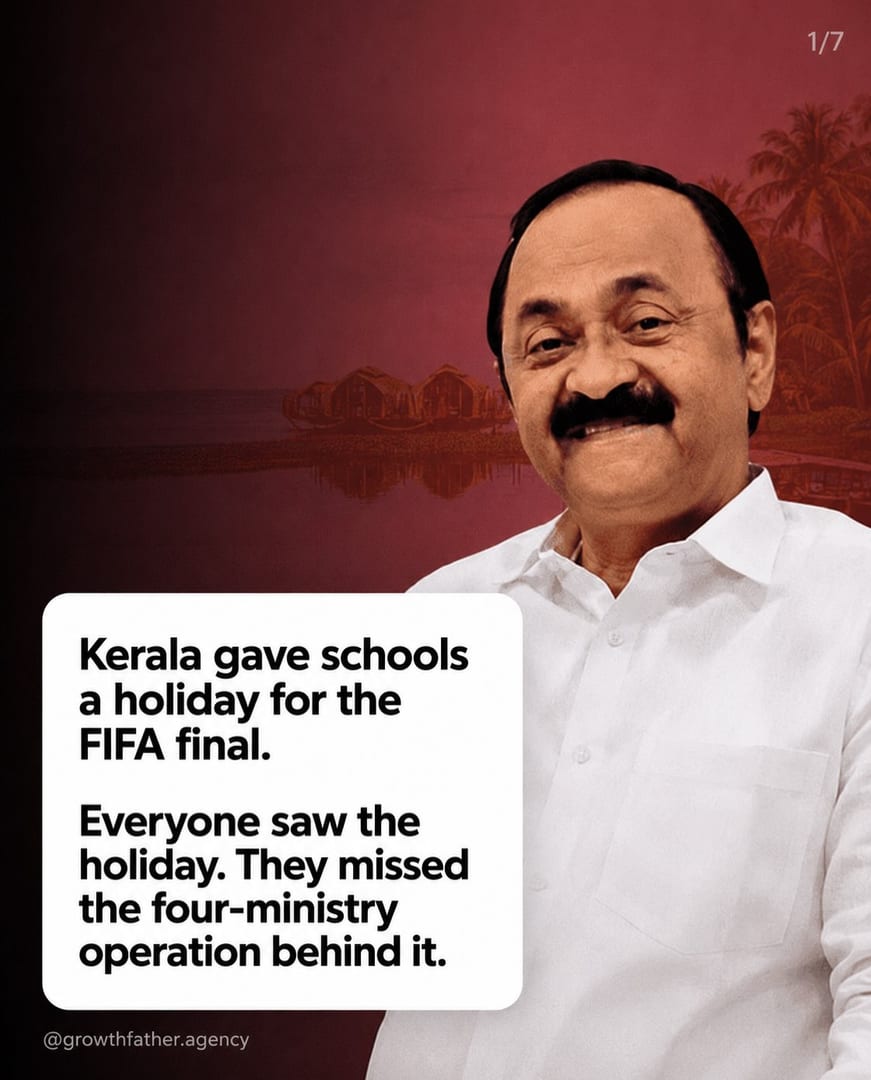
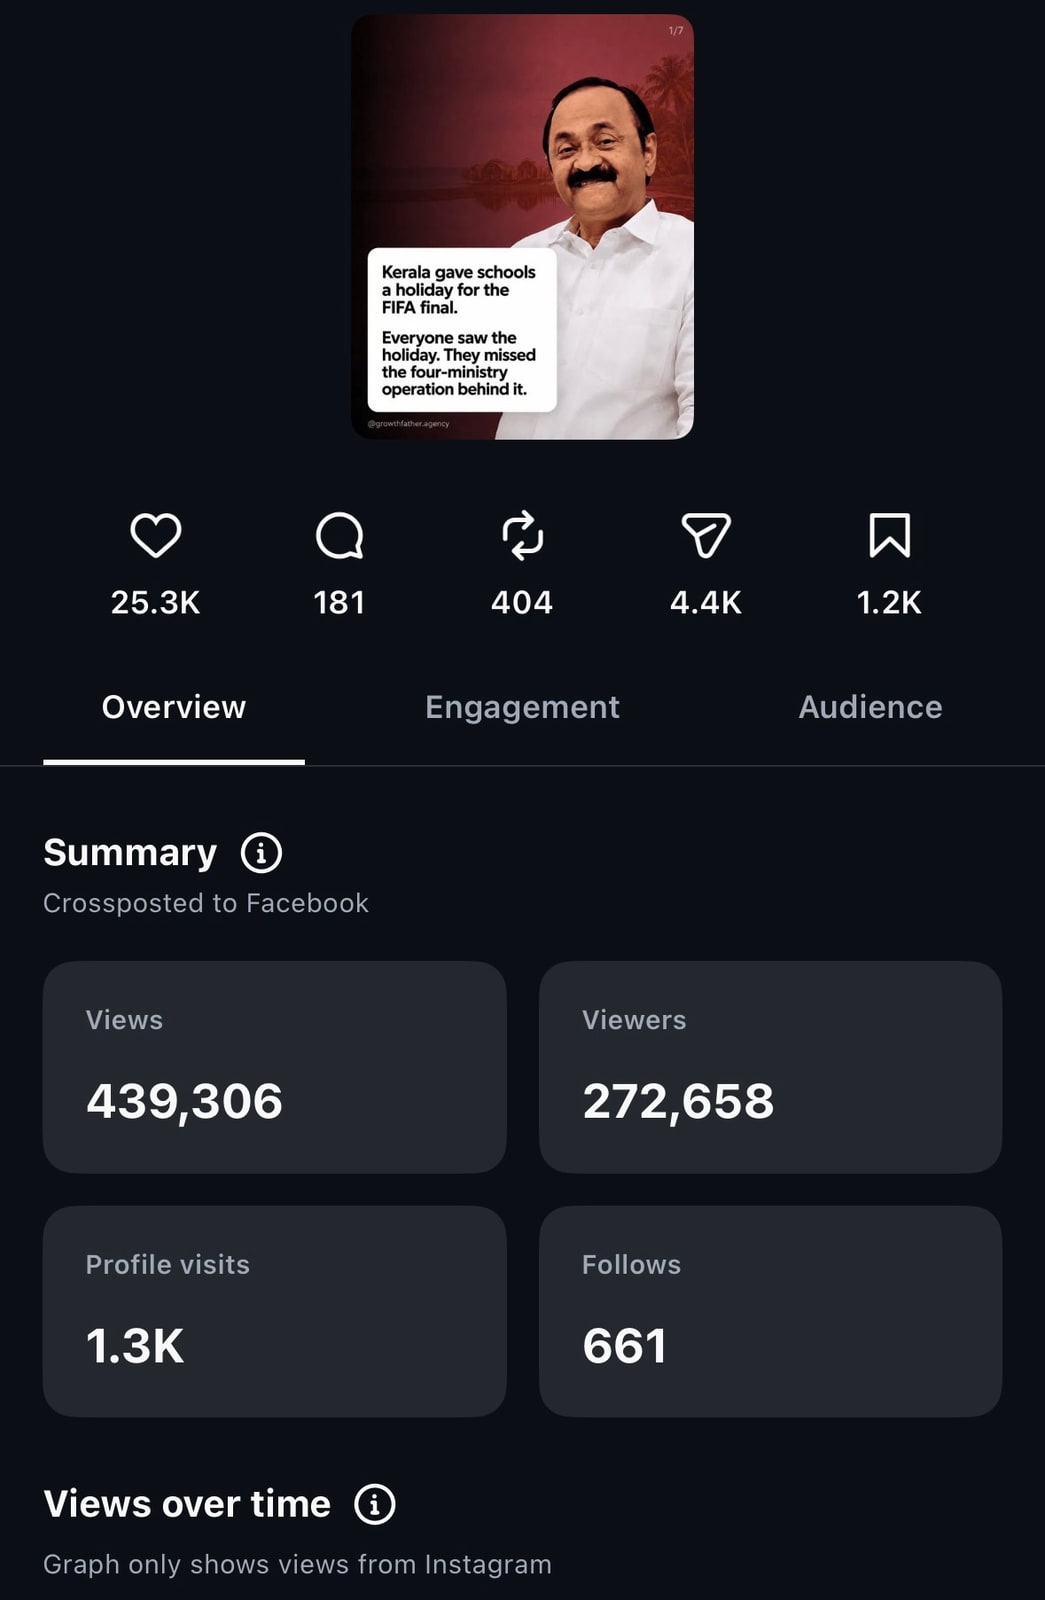
Everyone saw the holiday. Nobody saw the operation.
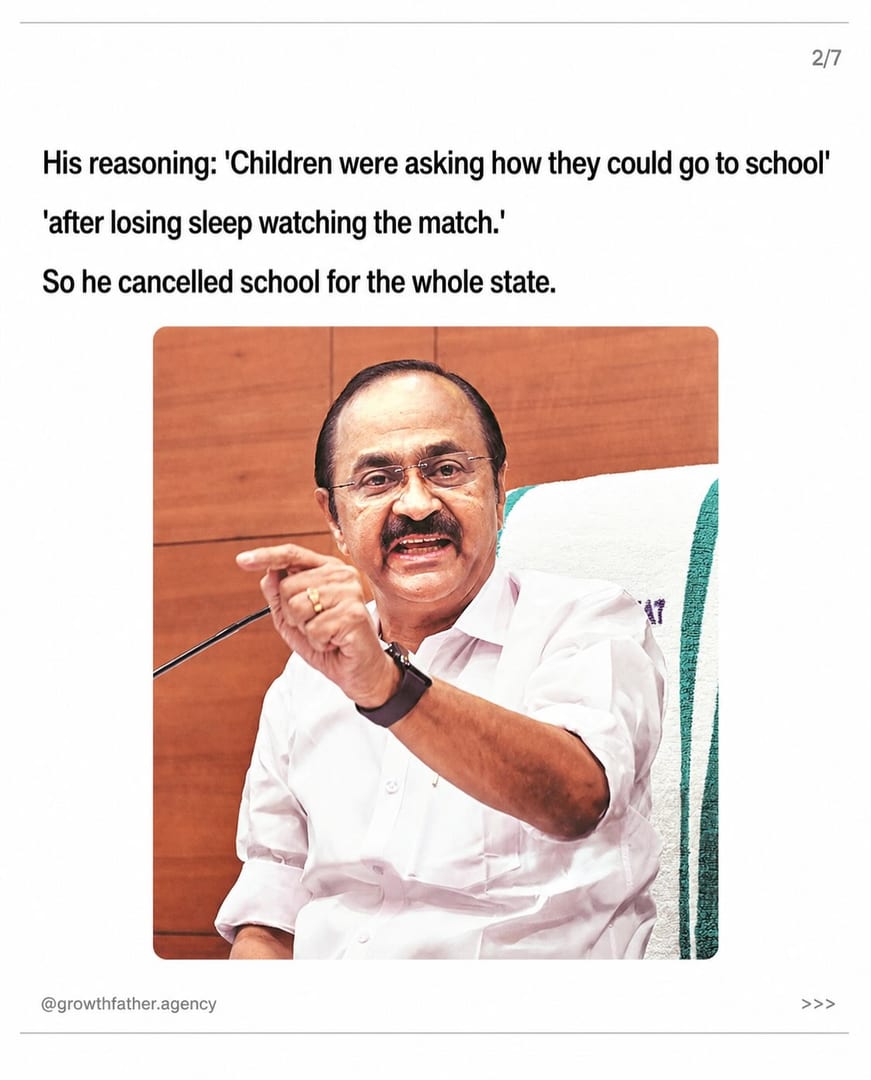
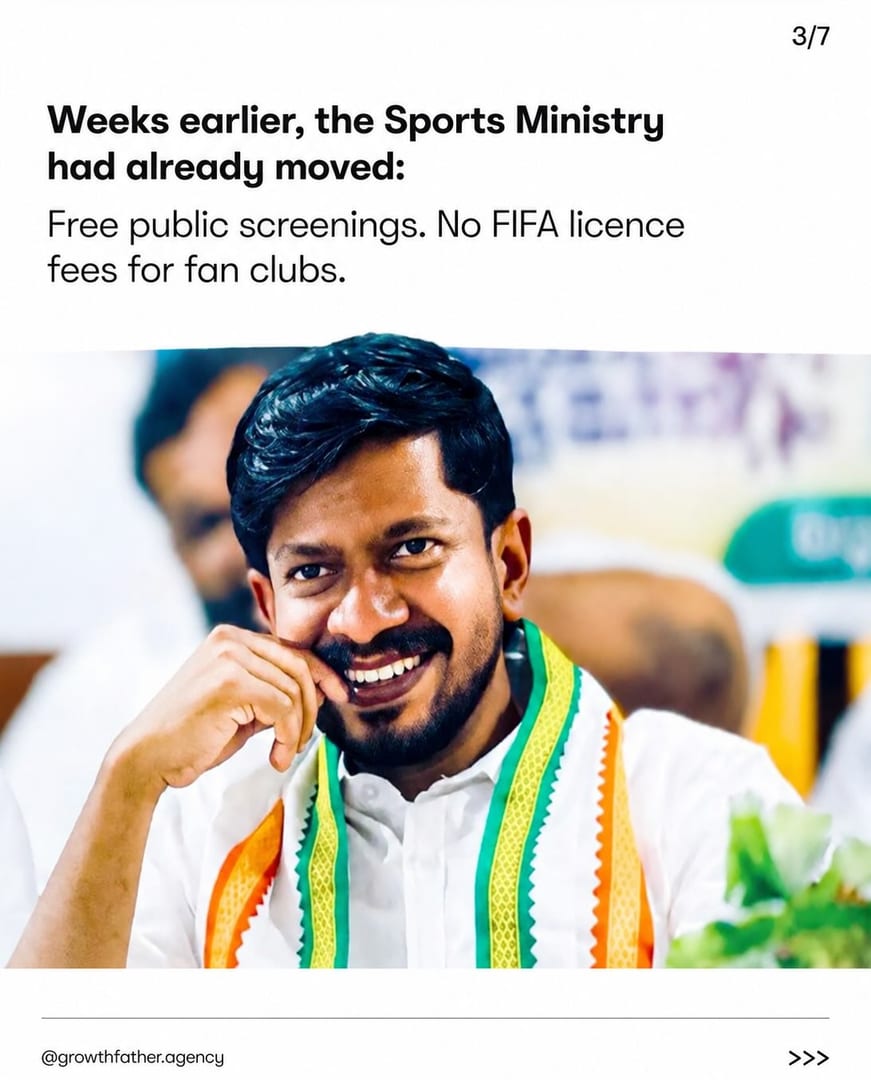
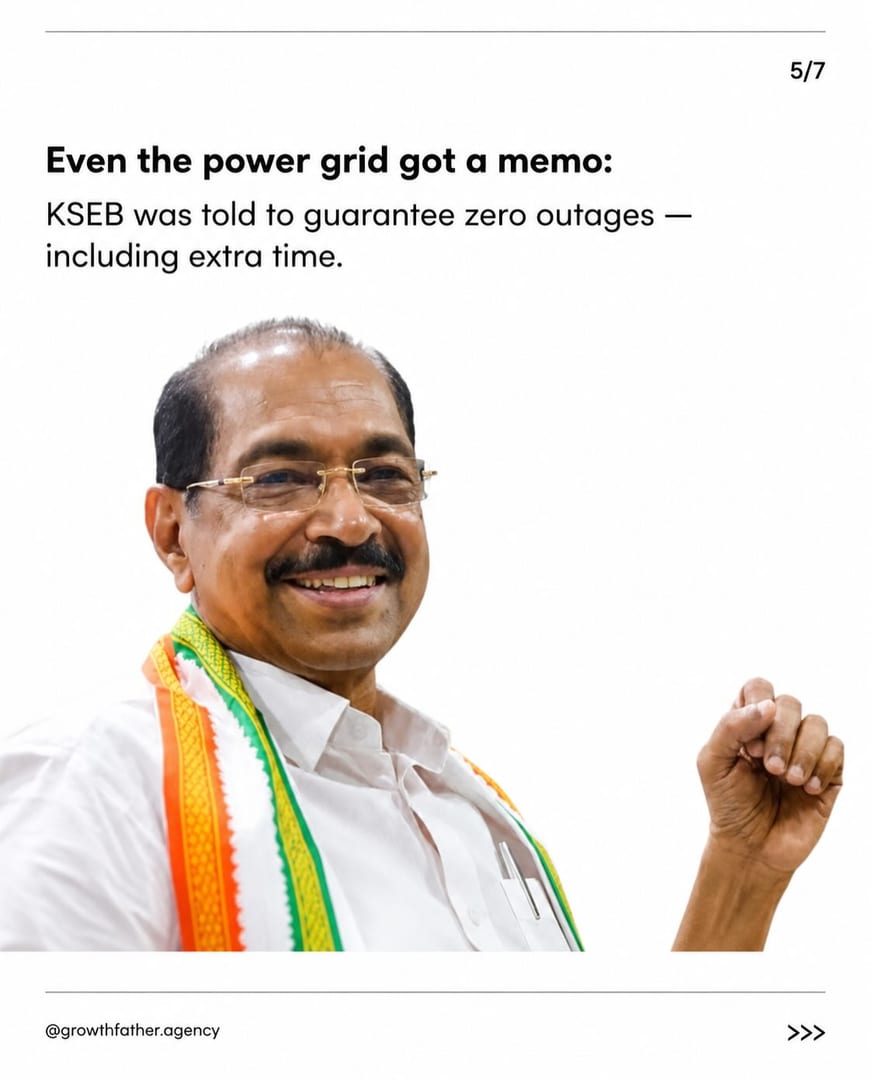
Kerala gave schools a day off for the FIFA final. That was the headline everyone shared. The actual story was the four-ministry operation that had to happen to make a public holiday appear overnight — so we opened on the thing people already knew and spent six slides on the part they didn't.
1/7
GF VD POStGrowthFather · 7 slides, in published order
Post insights for the GF VD POSt carousel — the strongest post-level result in this set. Instagram reports 25.3K likes, 181 comments, 404 shares and 4.4K saves.
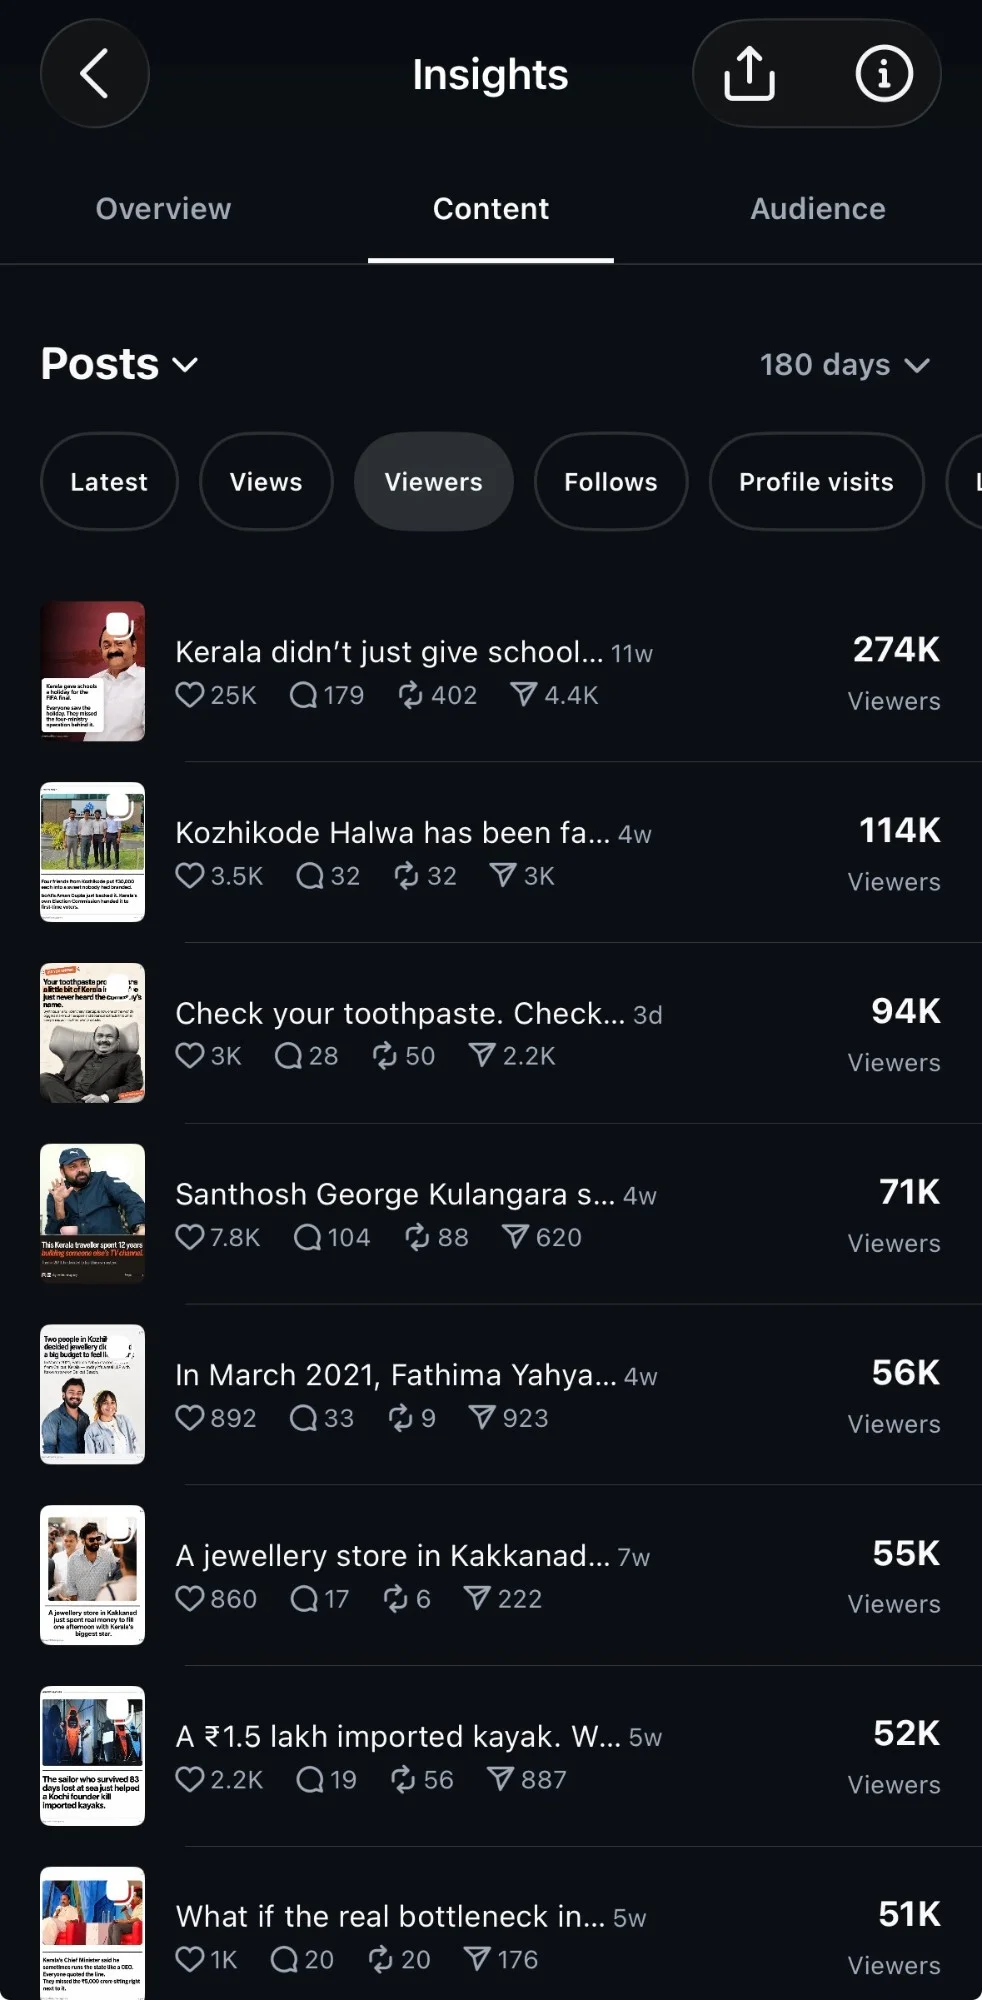
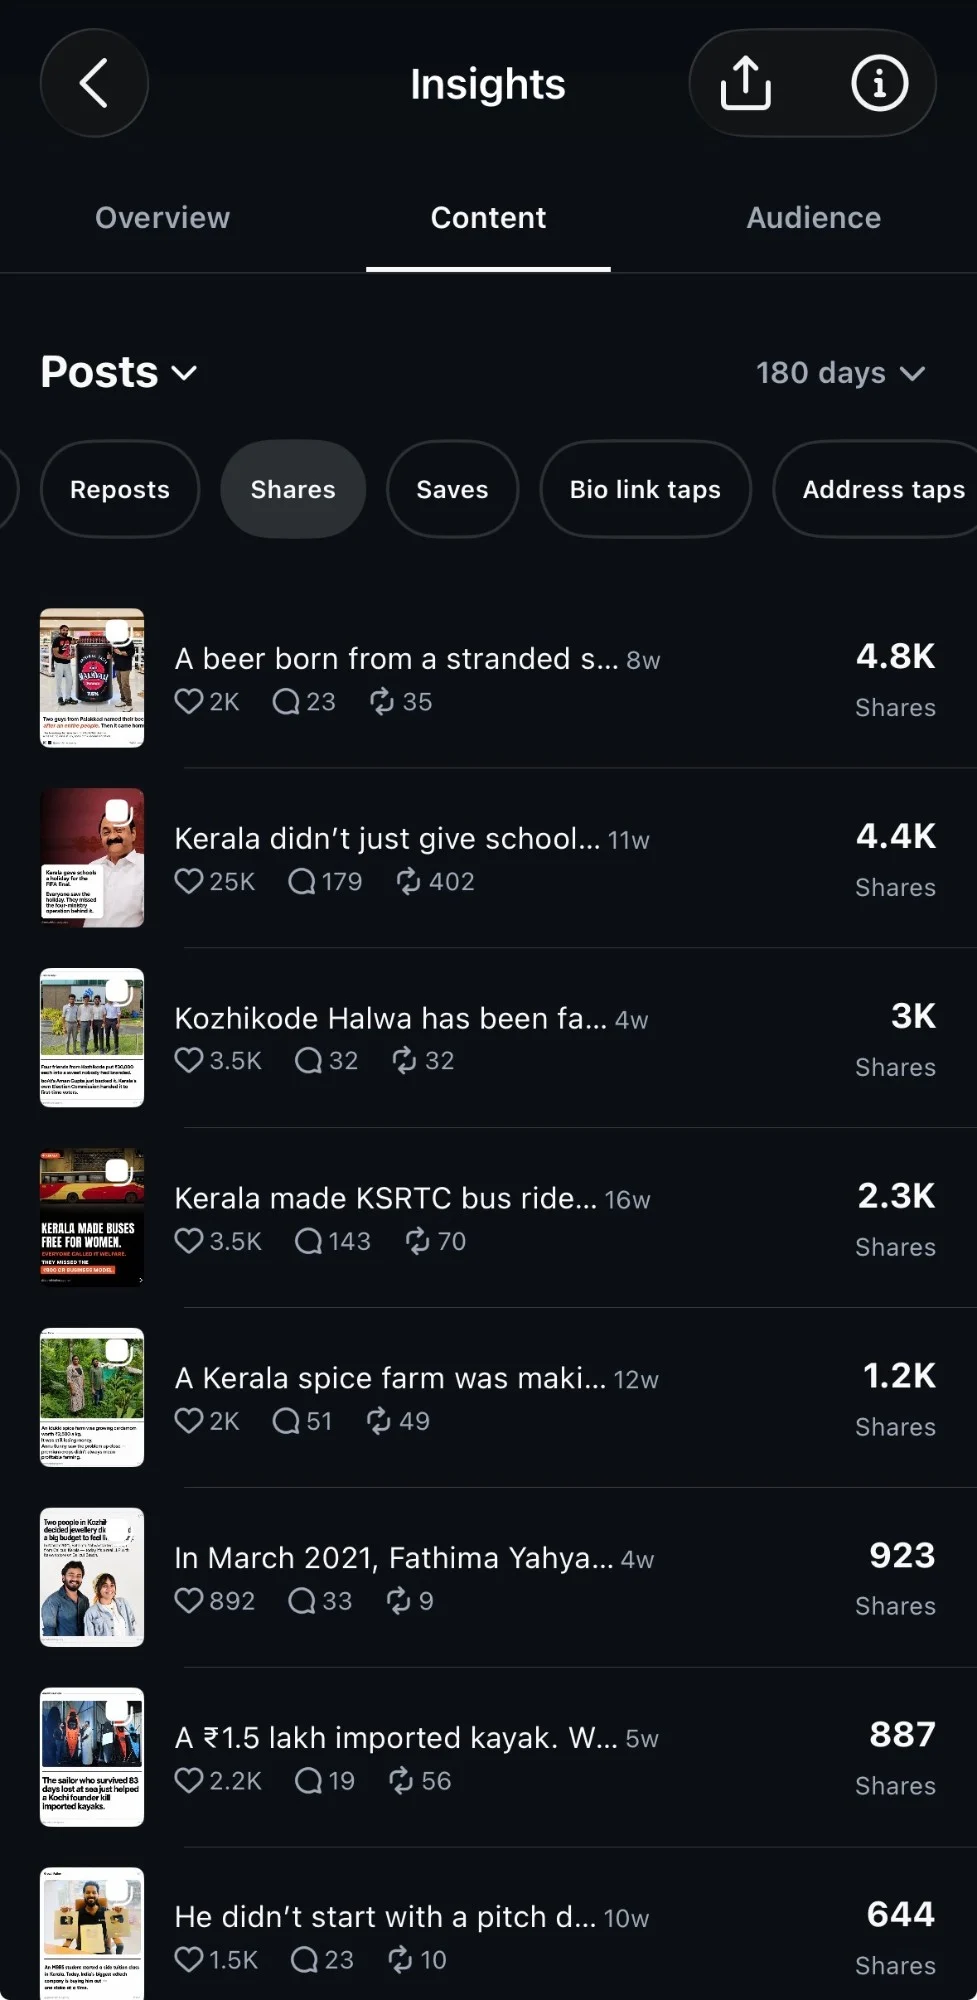
Post insights read 439,306 views. Instagram's 180-day list credits it with 274K viewers, 4.4K shares and 662 follows — #1 by viewers in that window. The two screens were captured at different times, so the figures differ slightly; both are shown rather than me picking the flattering one.
The spice company nobody could name
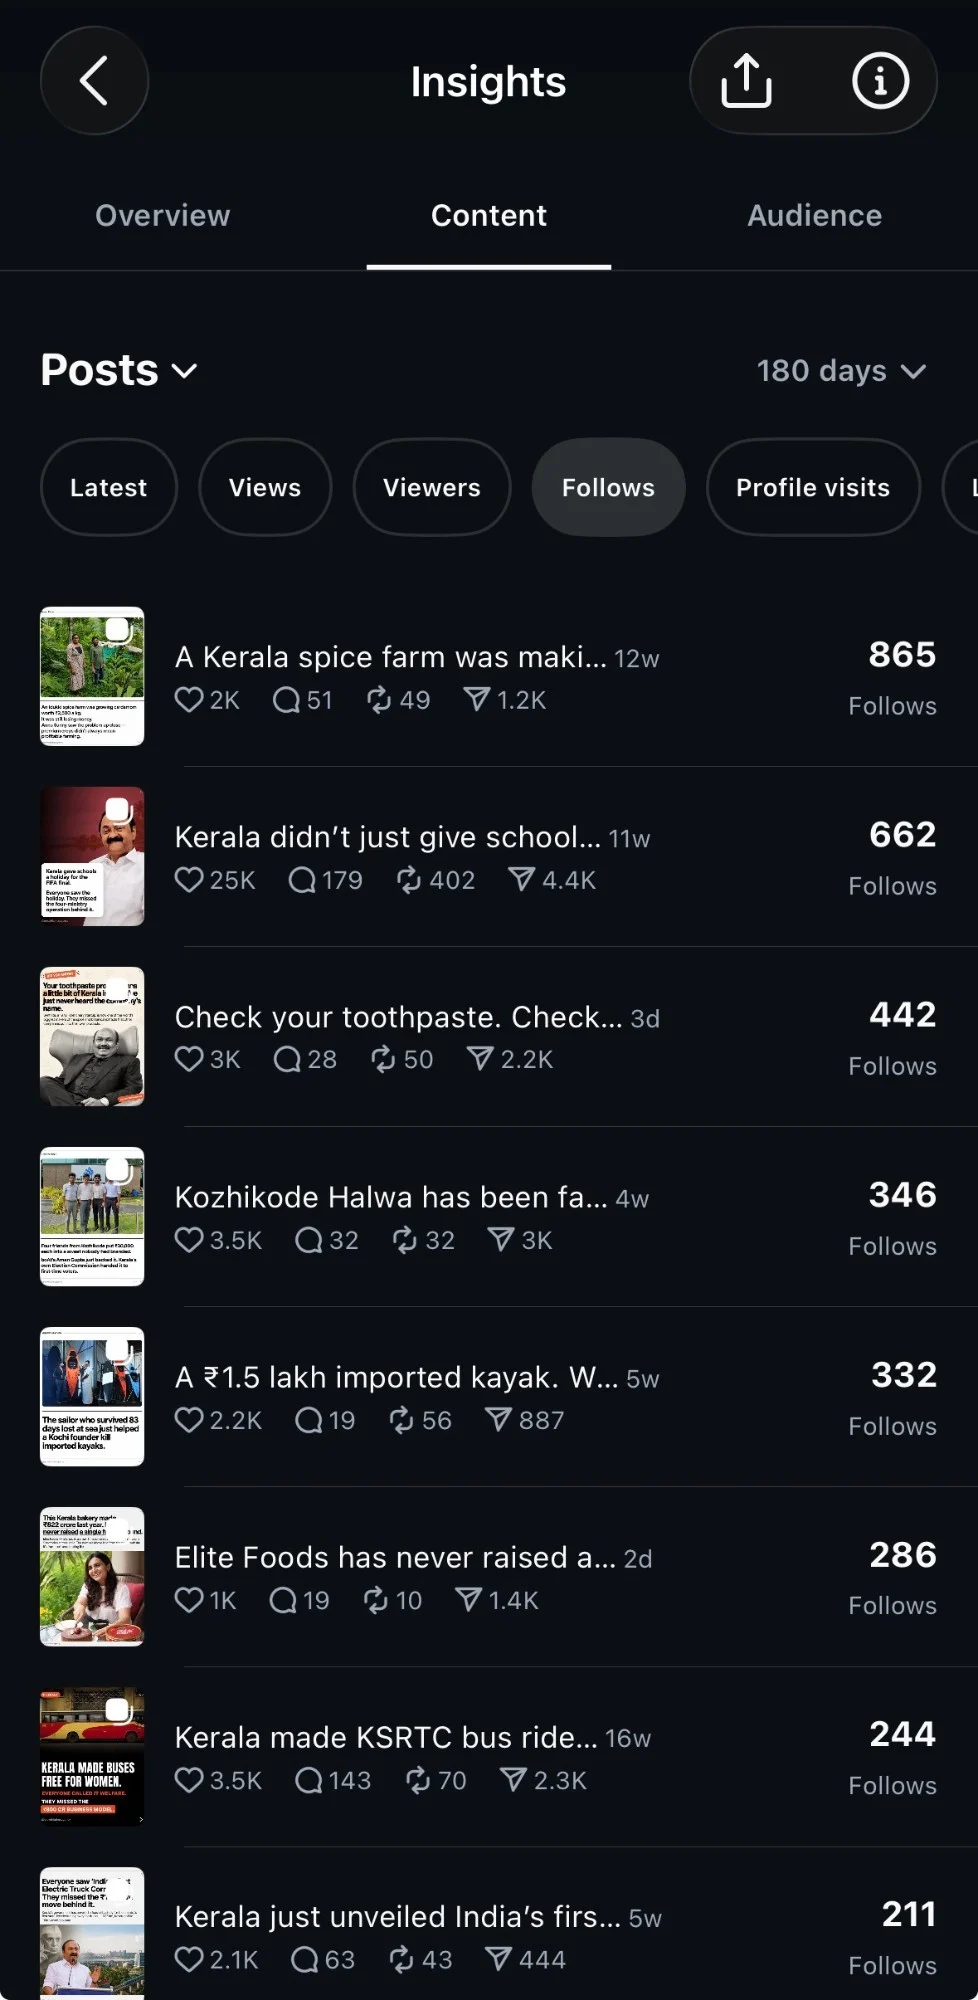
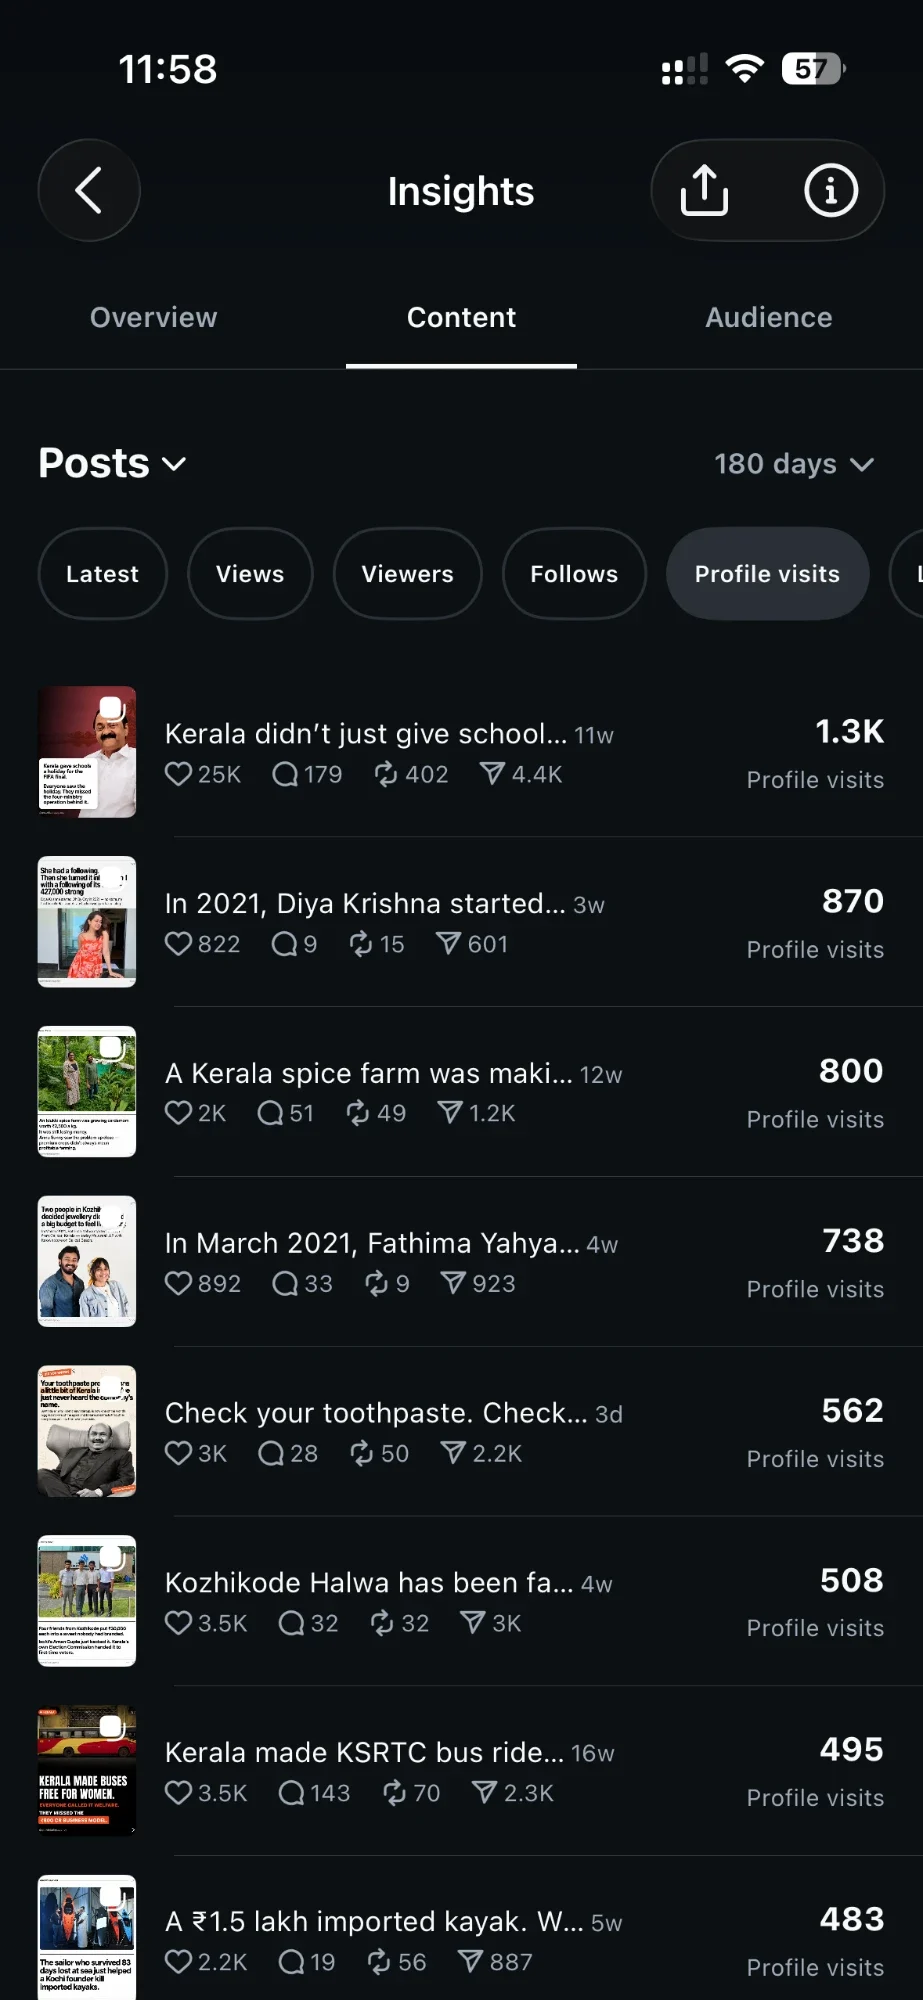
A Kerala spice business, told as a business story rather than a local-interest piece. This is the post that proved the whole direction — it brought in more follows than anything else we published in six months.
865
Follows — #1 in 180 days
1.2K
Shares
800
Profile visits
51
Comments
Instagram 180-day ranking by follows · tap to enlarge
The rest of the Kerala series
Same idea each time: one surprising fact on the cover, the company's story behind it.
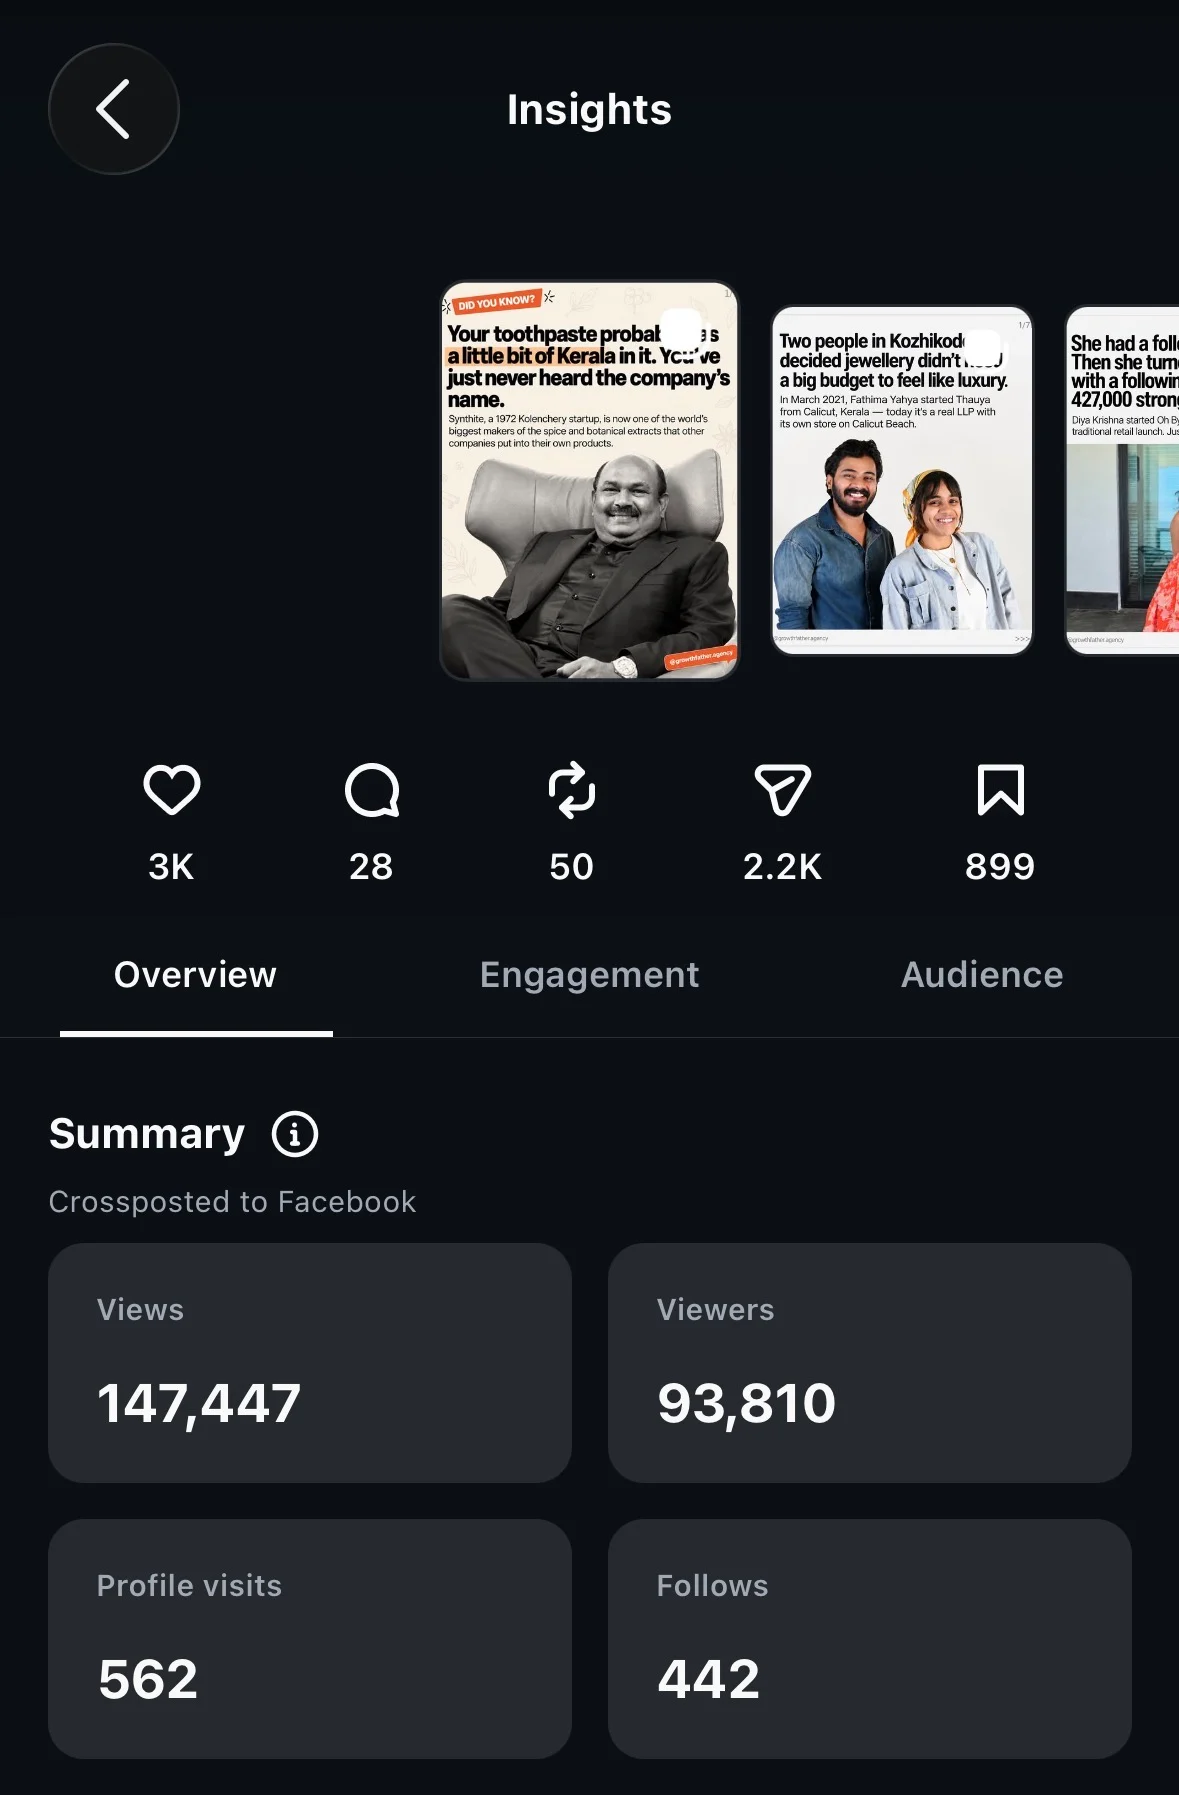
The toothpaste story
Your toothpaste probably has a bit of Kerala in it. You've just never heard the company's name.
147,447
Views
442
Follows
2.2K
Shares
899
Saves
Post insights; shares and saves read from the icon row
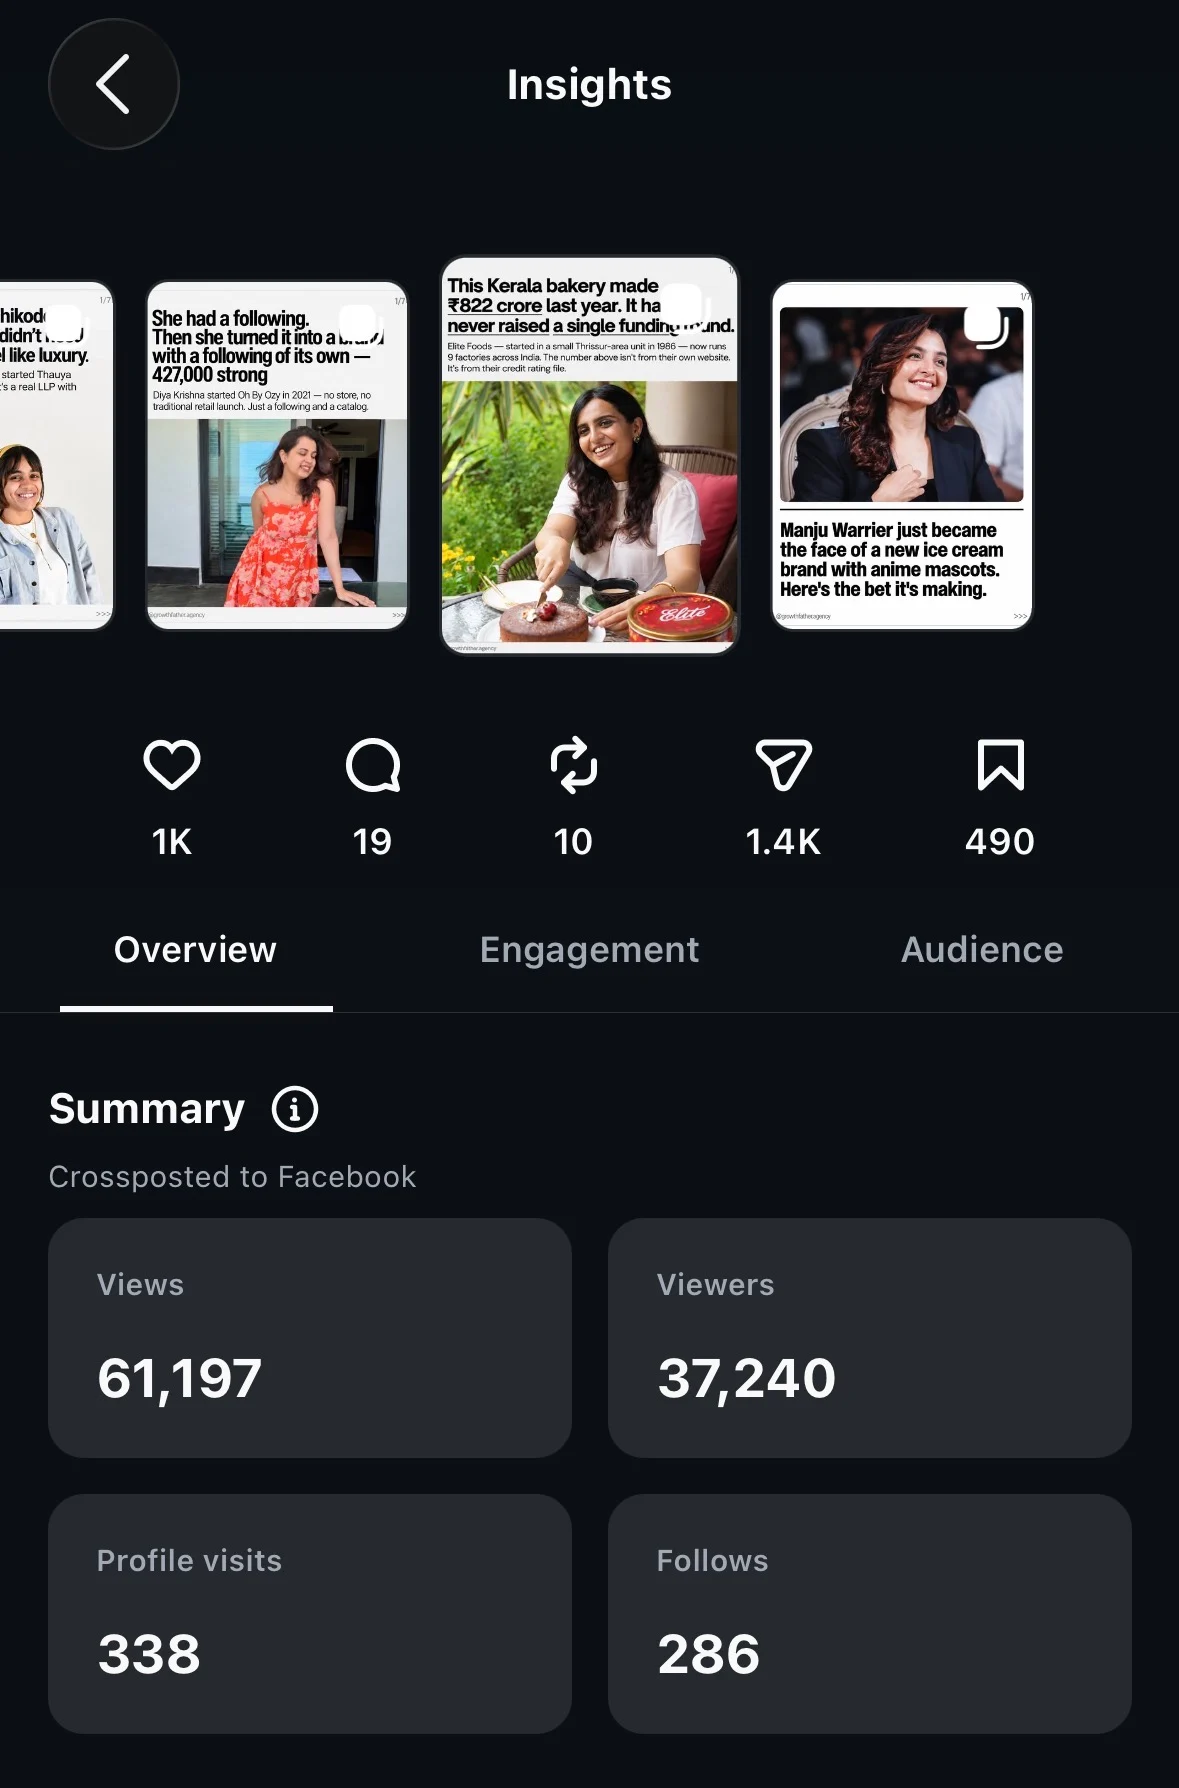
The bakery that never raised a round
₹822 crore last year, no funding. One number on the cover does the whole job.
61,197
Views
286
Follows
1.4K
Shares
490
Saves
Post insights
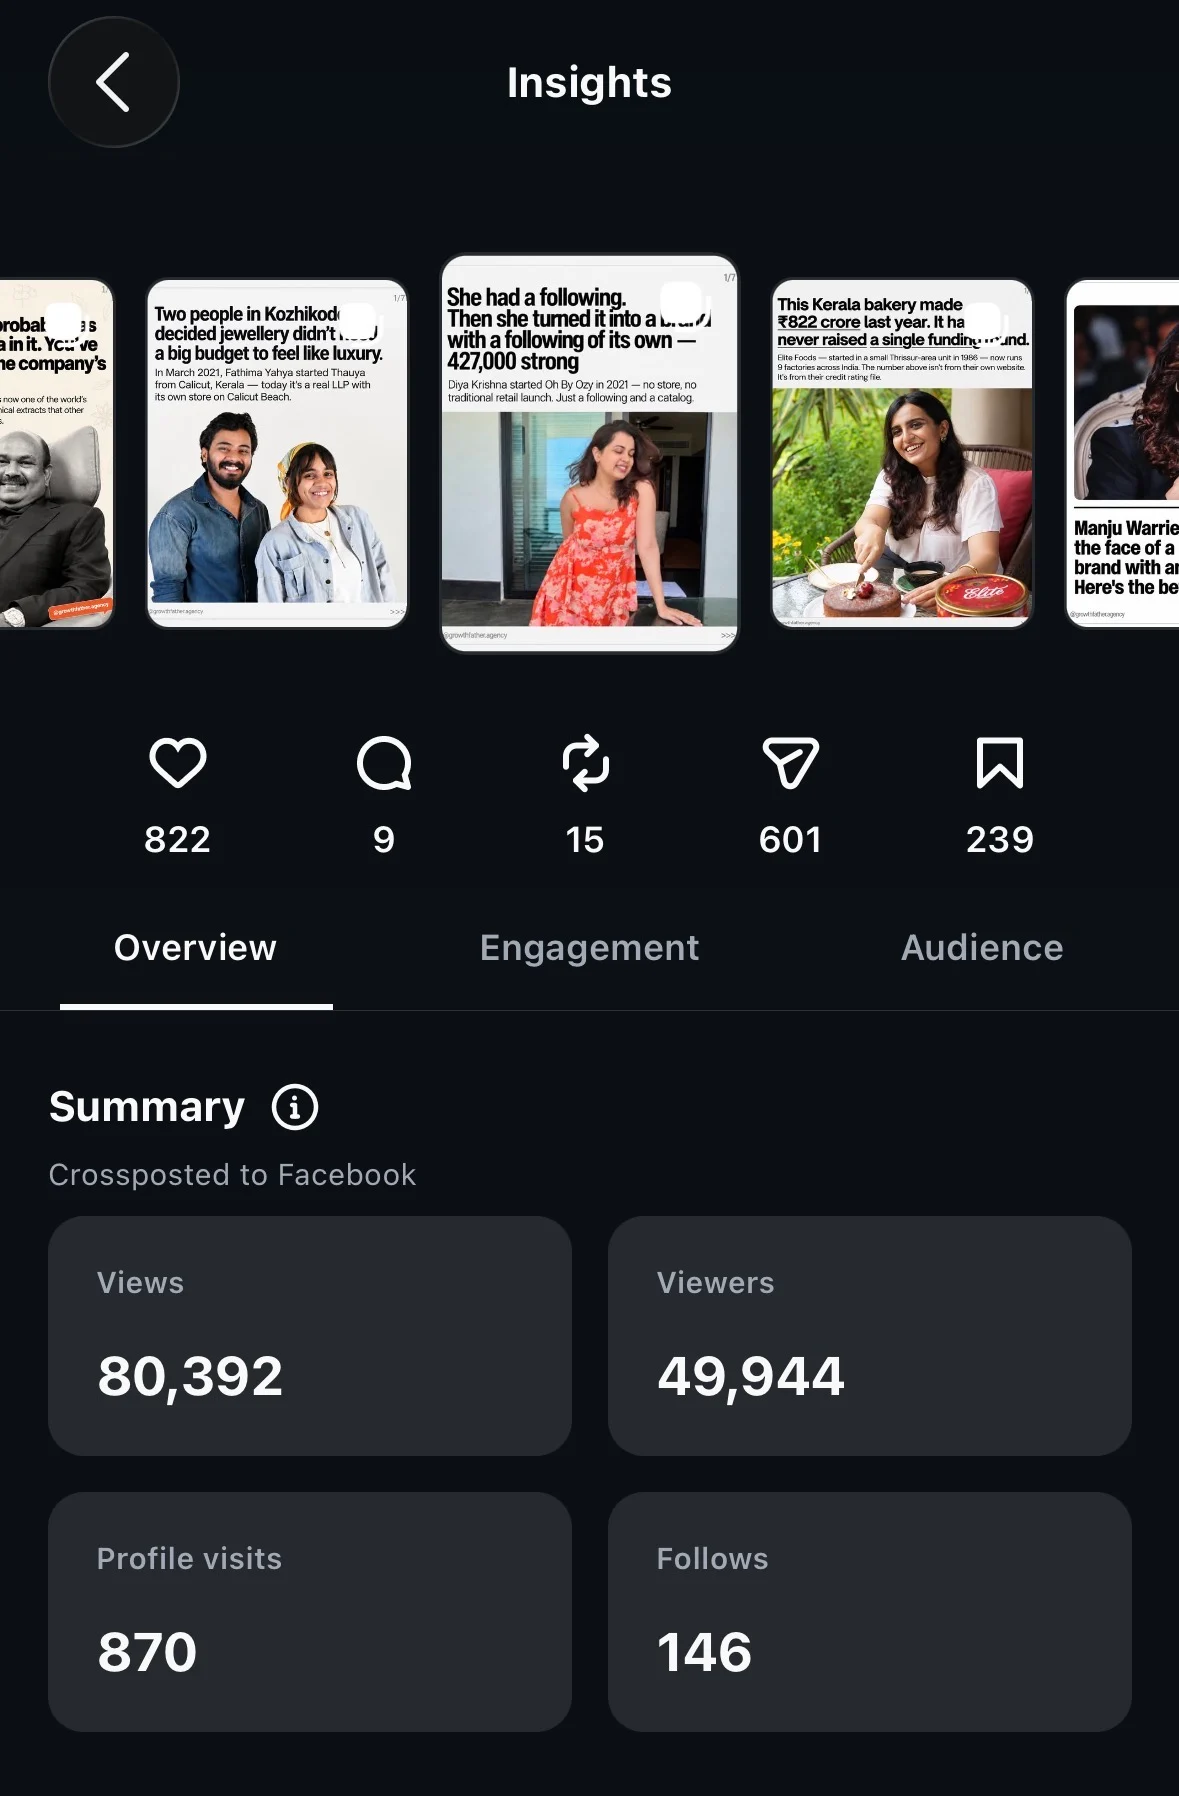
From a following to a brand
What happens after the audience is built — the part most people skip.
80,392
Views
146
Follows
Post insights
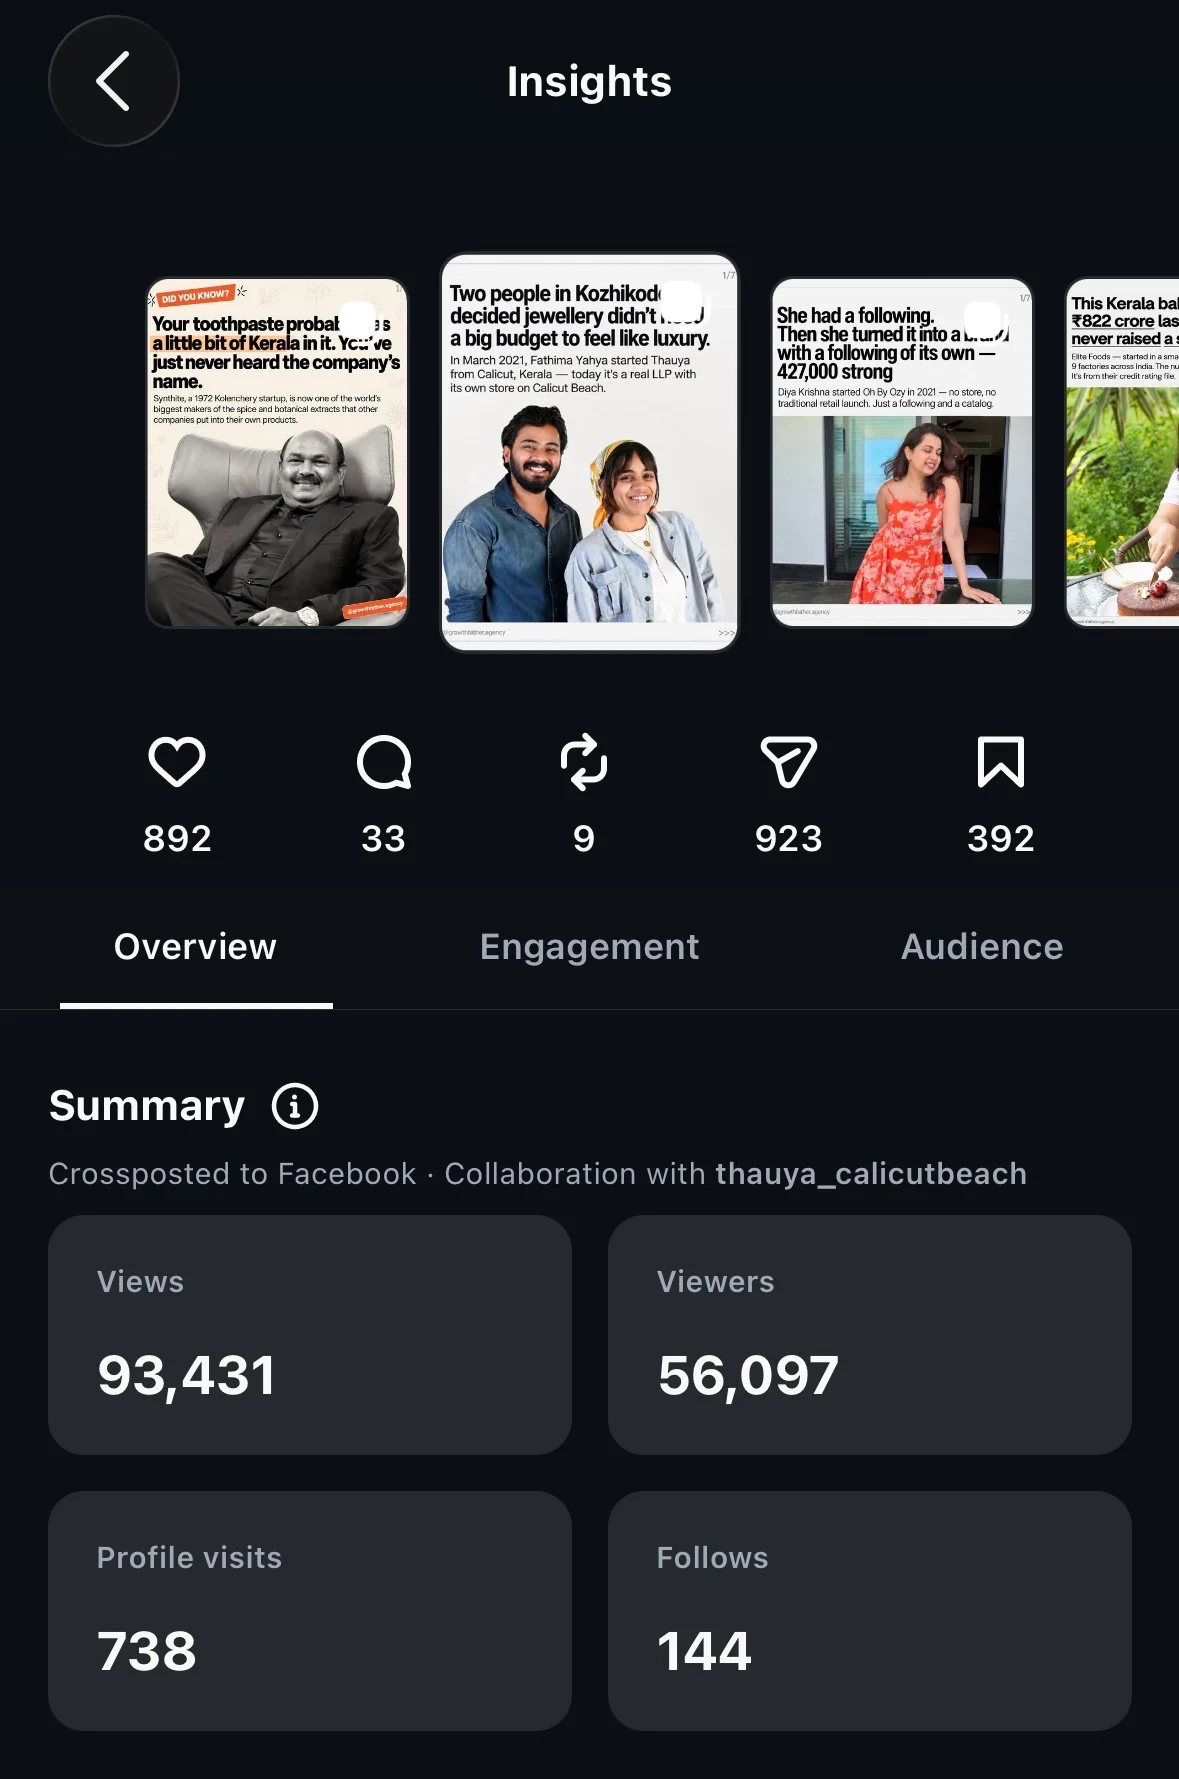
A Kozhikode jewellery story (93,431 views · 144 follows) belongs to this series too — I have its figures but not its artwork, so it isn't shown as a card.
Where these actually ranked
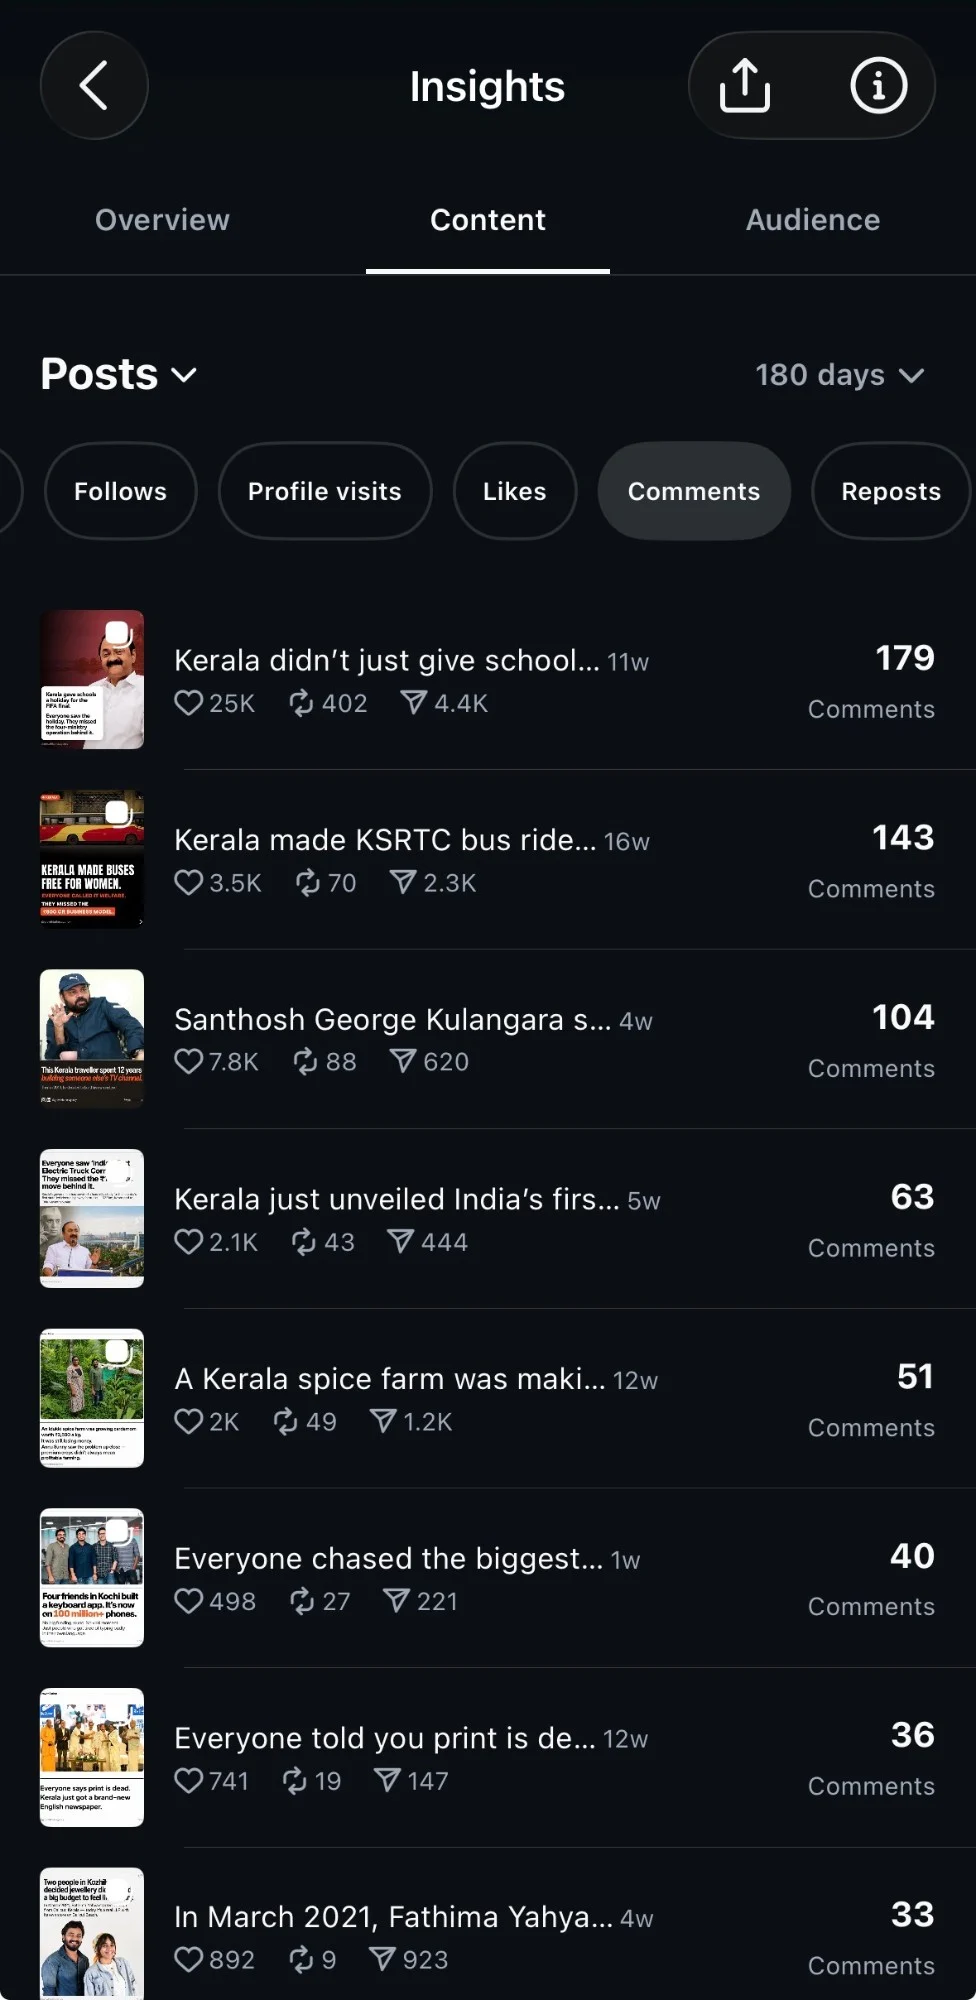
By viewers · 180 daysBy shares · 180 daysBy comments · 180 daysBy profile visits · 180 days
Instagram's own 180-day rankings — where the '#1 in 180 days' claims come from, rather than my word for it.
The reels
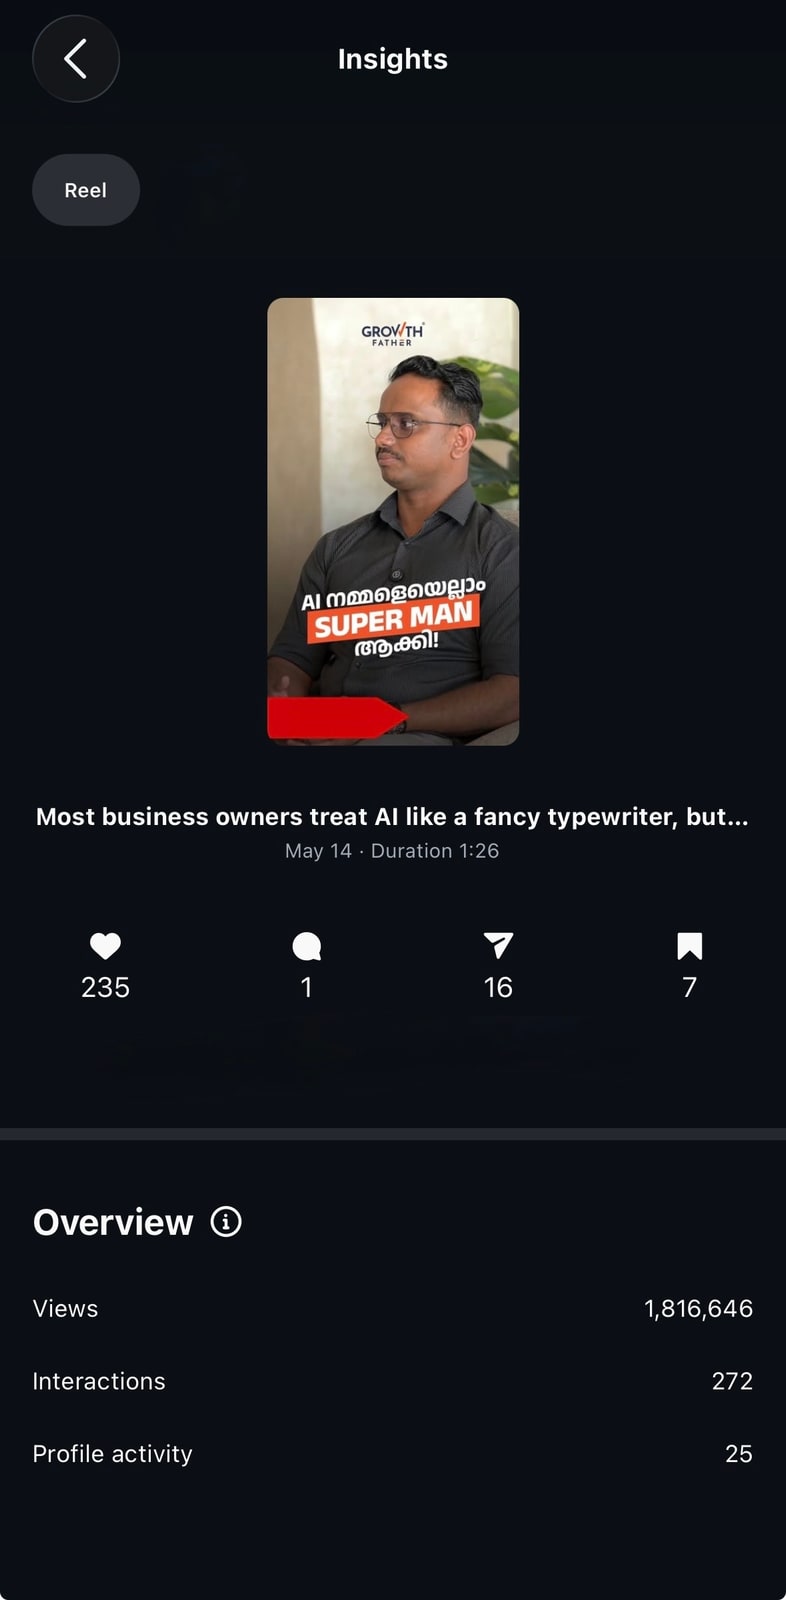
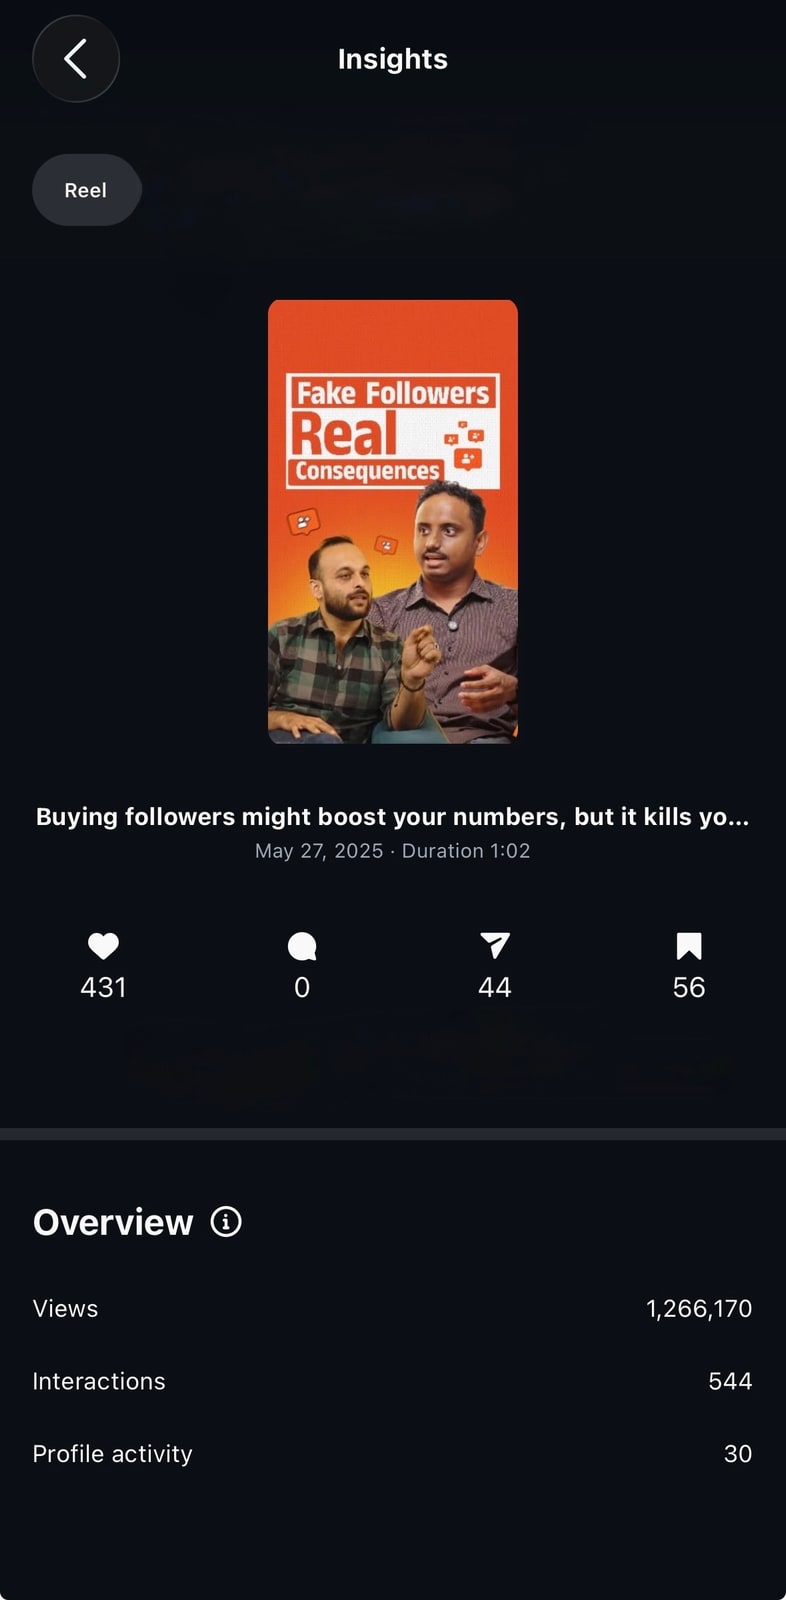
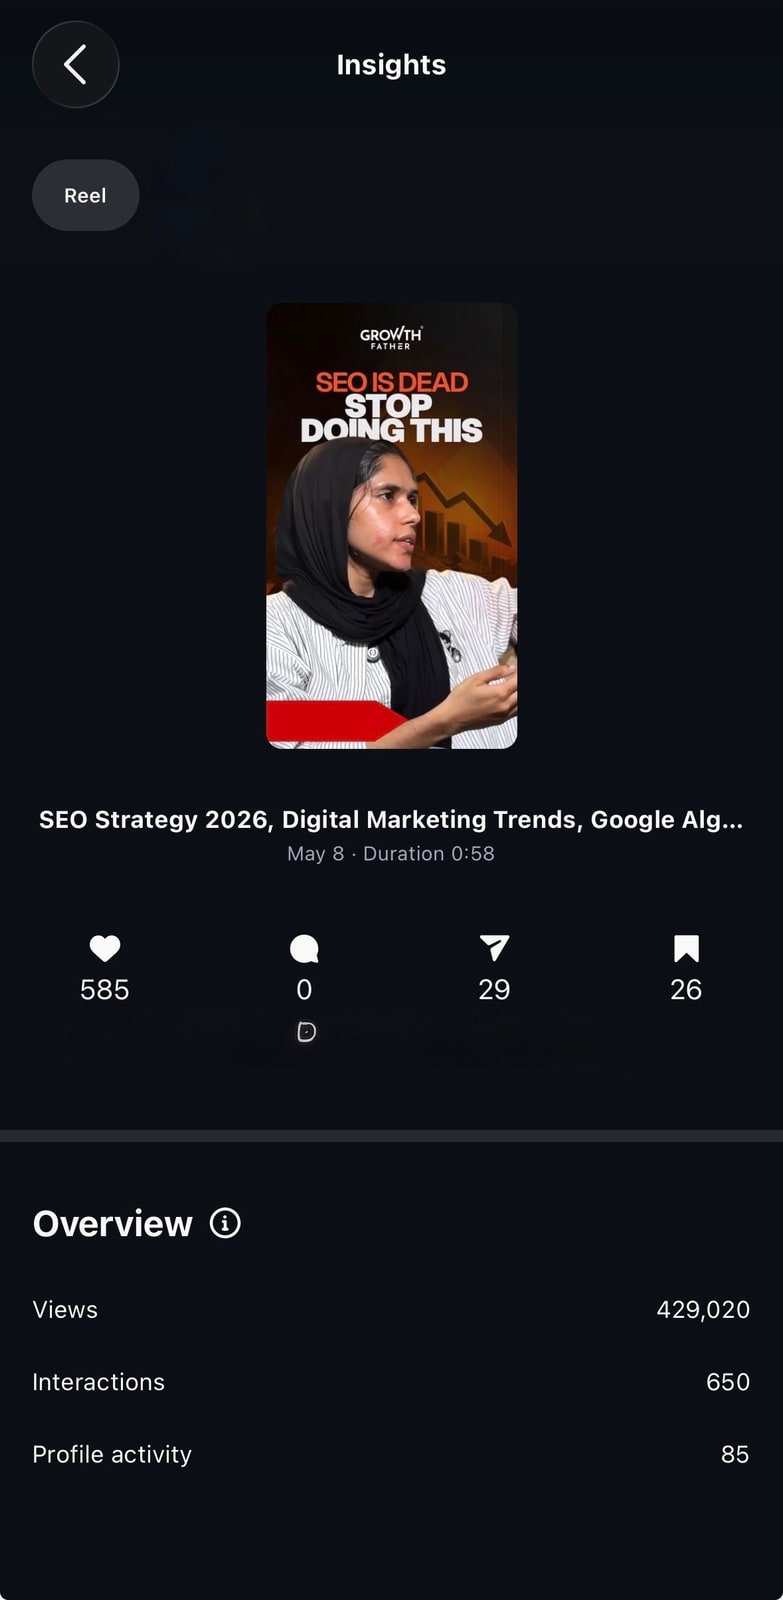
Three of these have view counts I can't fully explain. 1.8M views against 272 interactions is not a normal ratio for an account this size, and the screenshot doesn't tell me whether promotion was involved — so I'm not claiming it was organic. The collaboration reels below them are the more honest read: smaller numbers, but the skip rates are visible, including the one at 51.6% that I'd rather you see than not.
AI Super Man
Instagram · Posted 14 May (year not shown in the screenshot)
Overview insights for a 1:38 video. 'Interactions' here is Instagram's own grouped figure, not the same as reach or viewers. The very low interaction-to-view ratio is unexplained by the screenshot alone — whether any paid promotion was involved is unconfirmed.
Overview insights for a 0:58 video. Whether any paid promotion contributed is unconfirmed.
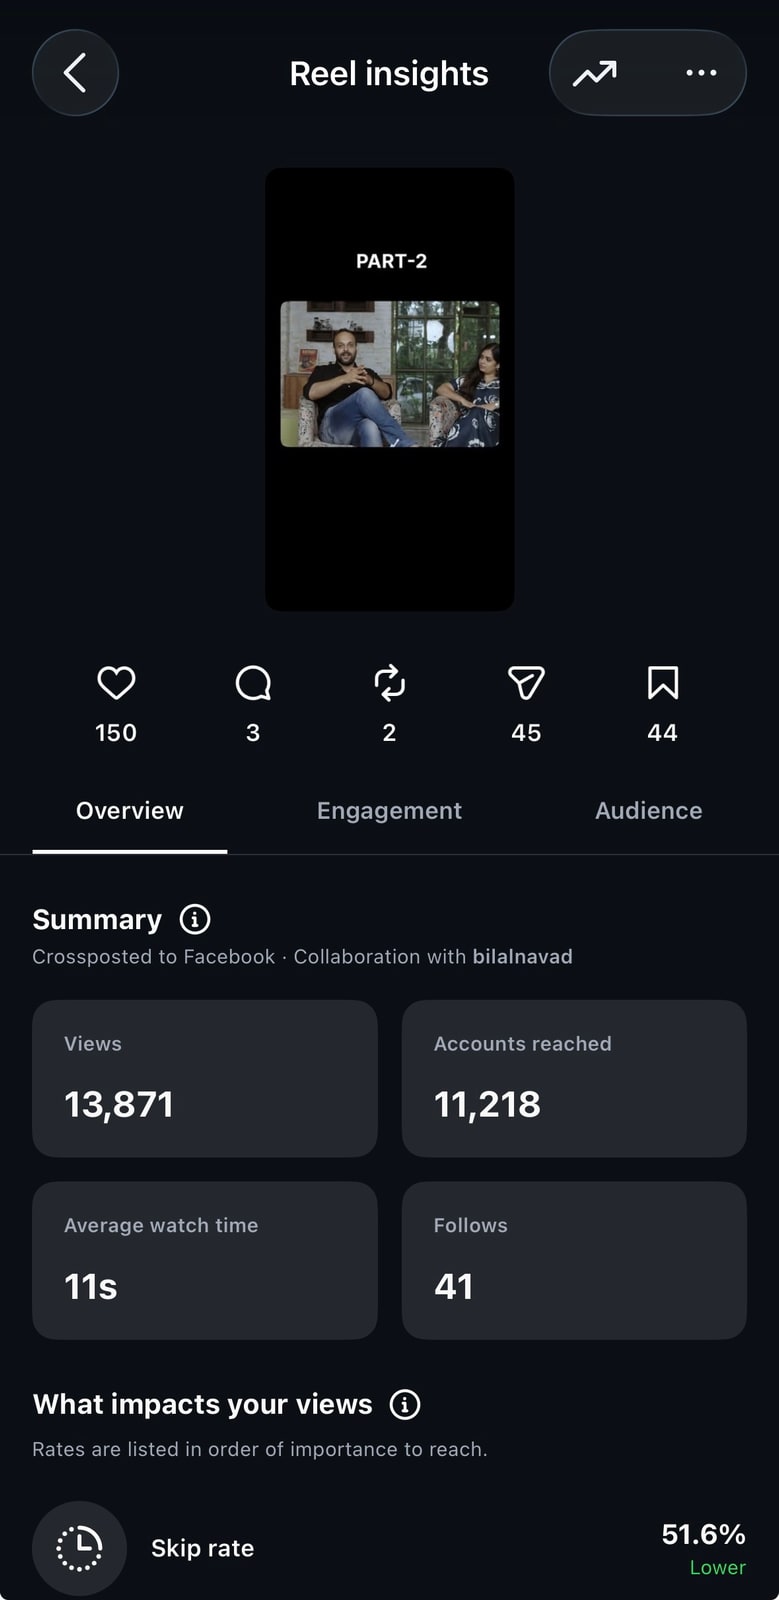
Part 2 — collaboration · 51.6% skip rate
Instagram
13,871 views · 11,218 accounts reached · 11s average watch time · 41 follows
Reel insights, shown as a collaboration post. Skip rate 51.6%. The reel itself was not supplied.
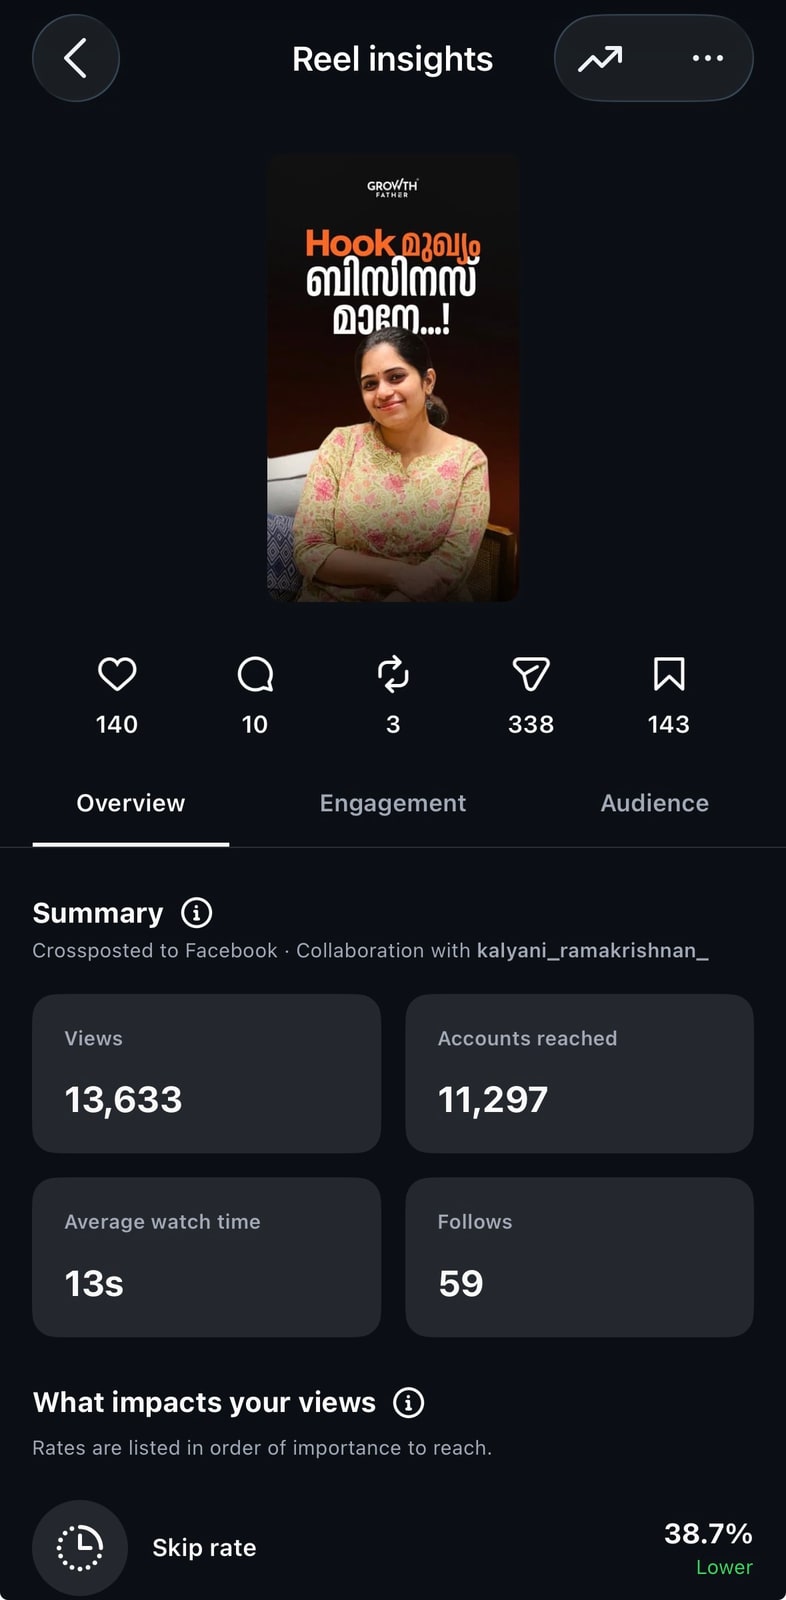
The Hook Reel — collaboration · 38.7% skip rate
Instagram
13,633 views · 11,297 accounts reached · 13s average watch time · 59 follows
Reel insights, shown as a collaboration post. Skip rate 38.7%. 338 saves. The reel itself was not supplied.
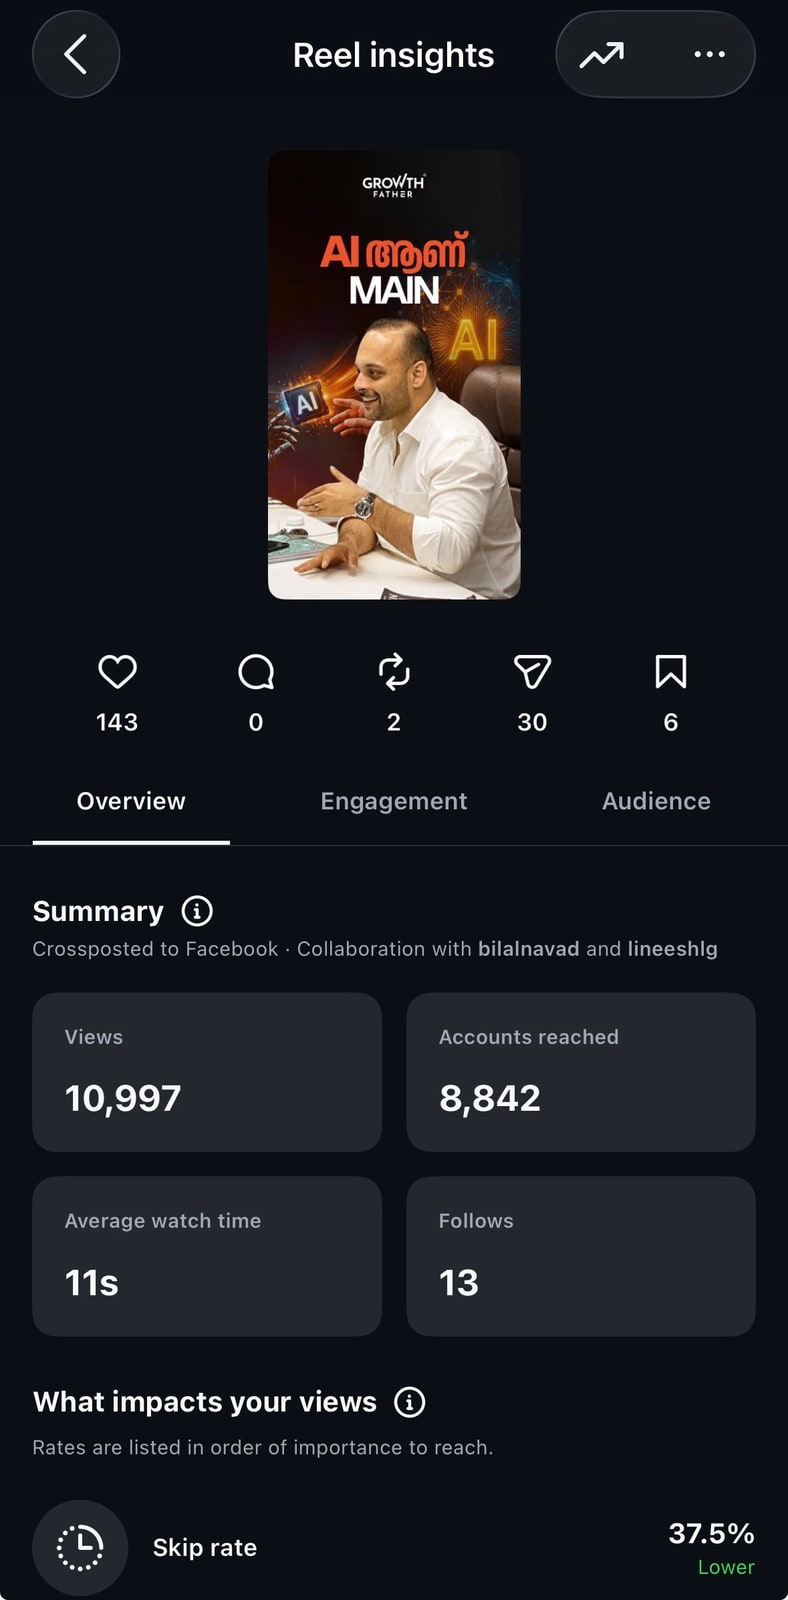
AI Is Main — collaboration · 37.5% skip rate
Instagram
10,997 views · 8,842 accounts reached · 11s average watch time · 13 follows
Reel insights, shown as a collaboration post. Skip rate 37.5%. The reel itself was not supplied.
07
The part I can't show you yet
The honest bit
What I'd tell someone starting this
We changed format six times before anything clicked, and the thing that finally worked wasn't a format at all — it was asking who we were actually talking to. Everything before that was us deciding what we wanted to say. The other half of it: learn to be suspicious of your best number. A 1.8M-view reel with 272 interactions taught me more about reading analytics honestly than any of the posts that genuinely worked.
Where this came from
Written for this site; the facts, figures and screenshots come from Abhi's own GrowthFather case study. Figures come from Meta Business Suite reports and individual Instagram post insights, quoted with their own labels and periods. All screenshots shown were recovered from that deployment and are unedited.
Still open
◦Sales-team voice confirmations on Instagram-led business, once reviewed.
◦The year for two reel post dates, which Instagram didn't display.
◦Whether paid promotion contributed to the three highest-view reels.
◦The Kozhikode jewellery story artwork — its figures are known, the creative isn't in the source set.
◦The reel video files themselves; only their insight screenshots exist here.